Chapter 16 - Advanced online research, search engine optimisation, analytics, sub-editing, and proof reading
Chapter 16 WEB VERSION Advanced online research, sub-editing, search engine optimisation and proof reading
In the book version of this chapter we will cover:
- Getting the most out of Google
- Google’s limitations
- Alternatives to Google
- Searching the deep or invisible web
- Sub-editing news
- Headlining news
- Subbing features
- Headlining features
- Proof-reading
- Sub-editing and Search Engine Optimisation
- What Google Analytics can tell you about your site's performance.
Also in the book
You will find a whole series of subbing exercises. On the website you will find that raw copy corrected as we think it needs to be to make it publishable.
At the end of the chapter are a range of exercises and projects to enable you to practise what you have learned.
Here we will look at
- The latest alternatives to Google search and developments in advanced search techniques
- Step-by-step tuition in using Google Analytics
- How to use the in-built analytic tools on social platforms including Twitter, Facebook and YouTube
- Answers to subbing exercises.
Always have the book version of Multimedia Journalism to hand while you use this website – the off- and on-line versions are designed to work together.
16C1 Advanced online research
In the book version of this module we outline the principles of advanced search techniques, and what can be achieved.
Here we will look at:
Links to all the material discussed in the book.
Search engines that may help you.
Getting the most out of Google
Google's advice on using 'search operators' to refine your searches: https://support.google.com/websearch/answer/136861
Search scholarly papers
Search within books
Set up a Google search on your own website
Alternatives to Google
Metasearch tools
Defined and explained here: http://en.wikipedia.org/wiki/Metasearch_engine
Clusty
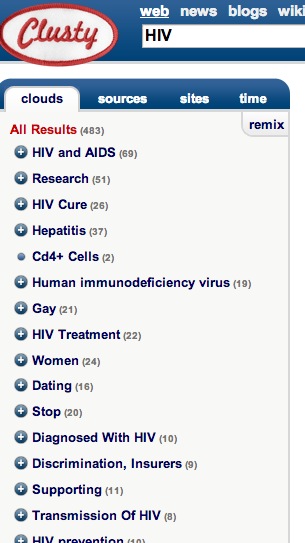
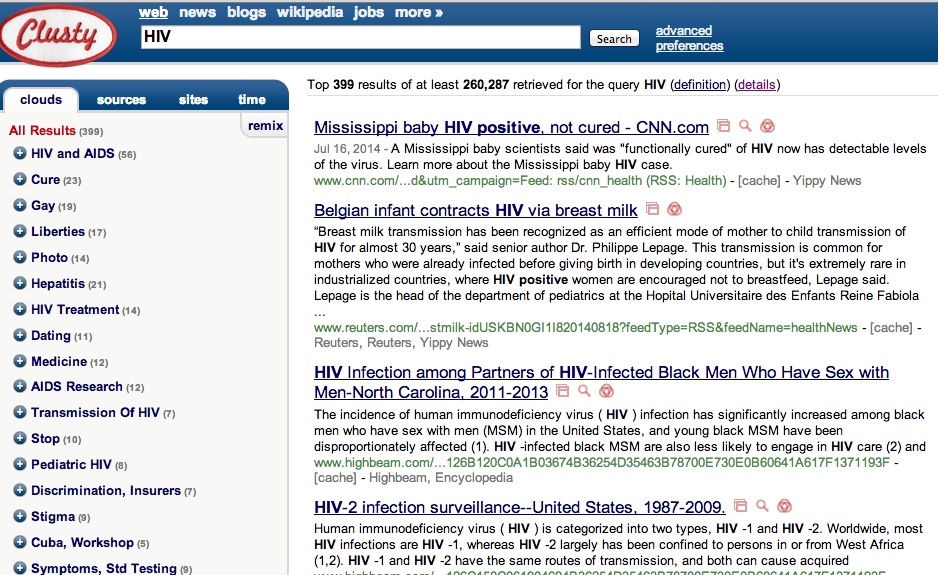
Clusty brings you general results in its main field, but also has a very useful box top left that gives you returns grouped – or clustered – into key categories.
You'll find a comprehensive guide on how to use the platform here: http://websearch.about.com/od/enginesanddirectories/a/clusty_2.htm
Here’s what a search for HIV has just returned me:
If I click on one of those clusters – Women, for example – I get returns organised under subdivisions of that cluster, including 'Pregnant women'.
Clusty can be useful if I am not sure what categories I need to search. Its returns alert me to areas where there are significant amounts of information and may alert me to important areas to research.
Surfwax.com
http://lookahead.surfwax.com/index-2011.html
The library at Berkeley (www.lib.berkeley.edu/) rates this as "A better than average set of search engines. Can mix with educational, US Govt tools, and news sources, or many other categories."
How to make these filtering devices work for you
To use these filtering devices successfully, you need to have an idea of where the result you need is likely to be found. So you need to think what kind of site you will find it on, and what format the document is likely to follow. Will it be a published report in PDF format on a government site, for example?For instance, if I am searching for official reports into deaths caused by MRSA infections in hospitals in Northern Ireland, I can search for: inurl:MRSA deaths "Northern Ireland" filetype:pdf and get straight to the official reports I need.
If you are uncertain how to go about this, Noodletools can help:
www.noodletools.com/debbie/literacies/information/5locate/adviceengine.html
Go to this site and it asks you a series of questions to determine what you are looking for.
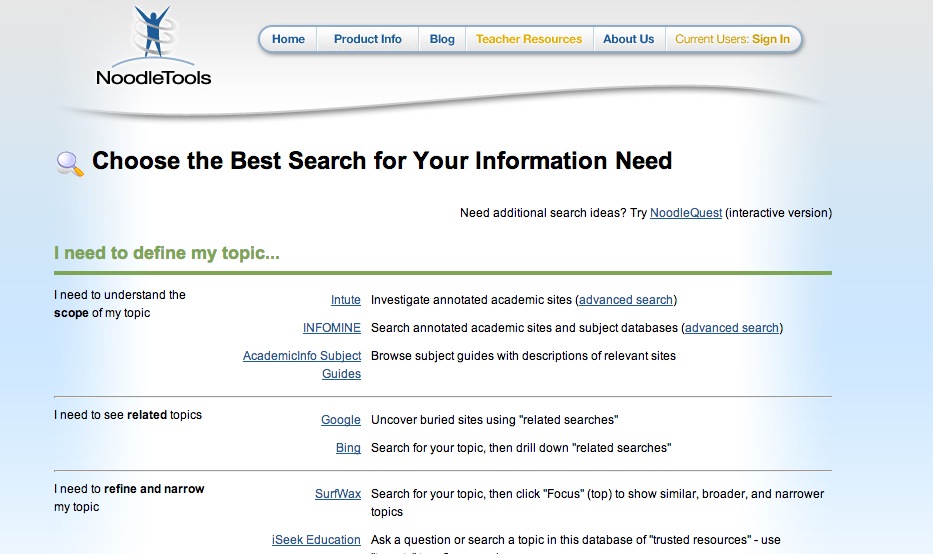
It will ask if you need to search a topic, refine a topic, find alternative or related topics and a number of other refinements. Along the way it suggests search engines that will help you do what you require.
It will help you find authoritative or scholarly results, results ranked as valuable or relevant or from primary resources. It will help you search within a discipline – government, health, law – or by time: today, recent, historical or ancient.
Vertical search tools
Business, economic and financial information
www.economy.com/freelunch/default.asp
Health
http://health-search.closerlooksearch.com/
www.ncbi.nlm.nih.gov/sites/entrez
Law and technology
Science
Searching the deep or invisible web
TechXtra
TechXtra lets you find content on engineering, mathematics and computing.
The Internet Archive
Gives access to movies, live music, audio, and printed materials – and older, saved versions of nearly every site ever created on the Internet.
InfoPlease
Allows you to search encyclopedias and other reference resources.
Closer Look
www.closerlooksearch.com/index.aspx
DeepWebTech
DeepWebTech provides search engines for specific topics. It covers science, medicine and business.
OAIster
OAIster describes itself as a catalogue of digital resources including ditigised books and articles, audio files, images and video plus datasets – statistics – that cannot be accessed from conventional search engines.
People search tools
Pipl
Pipl searches for people. As the site’s blurb says: “Since most personal profiles, public records and other people-related documents are stored in databases and not on static web pages, most of the higher-quality information about people is simply invisible to a regular search engine”.
Melissa Data
www.melissadata.com/lookups/index.htm
Whois
To find out who owns a website.
Research tools
The Librarians’ Internet Index
Academic research
These sites offer comprehensive, authoritative results for a wide range of subject searches.
Academic Info
They say: “Our in-depth directory is a round up of the best and most useful links and resources within a specific subject area. In most cases they list both printed reference works and electronic resources."
They add that the subject guides are put together taking into account accessibility, authoritative sources and their ease of use. They aim to present a "fair and well rounded" perspective of the respective subject matter.
HighWire
For searching academic journals.
Repository of Primary Sources
www.uiweb.uidaho.edu/special-collections/iil.htm
“A listing of over 5000 websites describing holdings of manuscripts, archives, rare books, historical photographs, and other primary sources.”
Ready, Net, Go
www.tulane.edu/~lmiller/ArchivesResources.html
A comprehensive index of archive resources.
Media search engines
For identifying newspapers – from local to national and international
Finding newspaper and magazine articles:
Wikipedia list of online newspaper archives
http://en.wikipedia.org/wiki/Wikipedia:List_of_online_newspaper_archives
US Newspaper Directory
http://chroniclingamerica.loc.gov/search/titles/
Library of Congress newspaper archive
http://catalog2.loc.gov/cgi-bin/Pwebrecon.cgi?DB=local&BBID=16944578&v3=1
British Newspaper Archive
www.britishnewspaperarchive.co.uk/
Mag Portal
16C2 Sub-editing
Further resources
What subs do at The Guardian: www.theguardian.com/commentisfree/2012/jul/26/subeditor-role-changed
Subbing as a job:
16C3 Sub-editing news
Answers to Exercise 1
Corrected words and facts are in Bold
1 A man who was washed out to sea while trying to rescue his dog was saved by lifeguards.
The man, who has not been named, was walking his dog on Bondi Beach, Sydney, Australia, when the animal suddenly swam out to sea, chasing a seagull.
The man swam after his pet but, said rescuers, suffered an attack of cramp and went under the surface. Rescuers got alongside him and, grabbing him round the waist, hauled him into their boat.
2 The Children’s Aid charity said that 40 tonnes of aid had been flown to the airport on Tuesday, 33 tonnes was received on Monday, and 15 over the weekend – a total of 87 tonnes. The total should read 88 tonnes.
The agency said that health was improving. After the latest relief effort, only one in seven children was suffering from malnutrition, compared with one in 12 at this time last year. Look carefully at those figures. Errors in fractions are often hard to spot. One in seven is actually more than one in 12 – which means that, if the figures are correct, malnutrition levels have gone up, not down. If you were subbing this piece of copy you would need to check with the writer to see what has gone wrong. Until you know what the correct figures are, you can’t put this piece of copy right.
3 George Walker Bush was re-elected president of the United States on November 2 2004. Both his supporters and opponents generally agree that his finest hour came when he showed powerful, decisive leadership after the attacks of September 11 2001.
Answers to Exercise 2
1 Freak flash floods have caused the cancellation of the Burning Man Festival.
Hundreds were turned away from the annual countercultural event, held in the deserts of northern Nevada, because the rains turned the site into a quagmire overnight.
2 Rice prices have risen for a sixth consecutive day as global supplies continue to be stretched by cyclone damage to crops in Burma.
Cyclone Nargis hit Burma on May 3, killing tens of thousands of people in the main rice-producing areas.
Rice prices had already hit all-time highs after some weak harvests.
3 Two female Japanese tourists kidnapped in Yemen by gunmen have been released after being held for less than a day, a security official has said.
Members of a tribe had seized the two to press for the release of a relative in government custody, according to the official.
Other members of the tribe mediated the tourists' release. They were seized as they visited Maarib, 176km (109 miles) east of the capital Sanaa.
There have been many kidnappings of foreigners in Yemen in recent years.
Answers to Exercise 3
1 A former Kuwaiti detainee at the Guantanamo Bay detention centre carried out [clearer and simpler than ‘was responsible for’] a suicide bombing in northern Iraq, according to Kuwait media sources.
A spokesman for the Kuwaiti government told the Associated Press that Abdullah al-Ajmi took part in an attack in Mosul on April 29 that killed several people. [The details of the attack are important and need to move up the story]
Ajmi and two other Kuwaitis blew up two explosive-packed vehicles next to Iraqi security forces, media reports say.
The US transferred Ajmi to Kuwaiti custody from Guantanamo Bay in 2005. [We follow details of the attack with background on how the release occurred.]
He was later acquitted by a Kuwaiti court of terrorism charges.
According to Kuwaiti media reports, Ajmi and his two alleged accomplices, Nasir al-Dawsari and Badr al-Harbi, were able to leave Kuwait a month ago without alerting the authorities because they had wrongly been issued with new passports.
They travelled to Syria, where Ajmi is reported to have told his family of his intentions, before heading on to Iraq.
The families of Ajmi and Harbi reportedly later received anonymous calls telling them that the men had died in Iraq. [If we had to cut this story for space reasons, this par could go first. That’s how it should be – with the Inverted Triangle we can cut copy from the bottom.]
2 A man cut his car in half with a chainsaw in protest at it being clamped outside his home.
James Naylor, from Islington, north London, admitted that his Nissan Micra was not taxed, but said it didn’t need to be because it was parked on his drive with only part of a rear wheel poking out on to the pavement.
The 30-year-old chef said the car was going to be scrapped anyway, but he wanted to make a point.
A spokesman for NCP Services, which has the contract to clamp untaxed vehicles from Mr Naylor’s local council, said half of the car was parked on the road and therefore the vehicle should have been taxed.
Mr Naylor said he had planned to restore the car, but had not got round to it.
"I had decided to get rid of it, but then I came home from work the other day and it had been clamped," he said. “I don’t know why they bothered – it doesn’t go.”
3 Millions of dollars being spent to prevent the spread of HIV is wasted on strategies that do very little good, researchers allege.
The claim comes from American researchers who call for a "dramatic shift" in priorities.
Multi-million dollar spending on promoting the use of condoms, HIV testing and vaccine research has had limited success in Africa, argue the researchers from Harvard University School of Public Health in the journal Science.
They say male circumcision and cutting the number of sexual partners should become the cornerstone of prevention.
Two-thirds of all HIV infections occur in Africa, yet the researchers say that there is very little evidence to demonstrate the effectiveness of many of the prevention strategies used in the continent.
Answers to Exercise 4
1 US researchers have found a way to kill unwanted plants and animals that hitch a ride in the ballast waters of cargo tankers.
The United Nations says that "invasive species" carried in ballast water picked up in one part of the world and then pumped out in another represent one of the four main threats to the world's marine ecosystems.
Tests have shown that a continuous blast of microwaves in the tanks will remove all marine life.
Over 80 per cent of the world's commodities are moved by ship, and up to five billion tonnes of ballast water is transported internationally each year, according to the UN.
When a ship's cargo is unloaded, it takes on ballast water to provide stability. When it takes on another load, often on the other side of the world, the water is discharged.
The findings will appear in the journal Environmental Science and Technology. [150 words]
2 At least 8,500 people have been killed by a powerful earthquake in China's south-western Sichuan province.
Many more are believed killed and injured elsewhere in the country after the quake, which measured 7.8 on the Richter Scale, struck at 2.30pm.
At least 60 bodies have been recovered from the rubble of a school where it is believed 900 students were buried alive.
President Xi Jinping has pledged that there will be an all-out effort to rescue victims.
The epicentre of the earthquake was about 92km from Chengdu, Sichuan's provincial capital.
Because the earthquake struck in the middle of the day, it is feared that many schoolchildren may be among the victims. [112 words]
3 Face-recognition technology that can prevent underage smokers buying cigarettes from vending machines is being developed by a Japanese company.
Fujitaka is installing cameras in machines that count wrinkles and skin sags to check a smoker's age.
New Japanese legislation means that, from July, vending machine owners could be prosecuted if they sell tobacco to anyone under the legal limit of 20.
Would-be smokers who fail the digital camera age test have to show the machine an ID card to establish they are legally allowed to smoke.
The system compares facial characteristics including bone structure, sags and crow's feet against a record of more than 100,000 people in order to estimate a purchaser’s age.
Fujitaka spokesman Hajime Yamamoto told Reuters: "With face recognition, so long as you've got some change and you are an adult, you can buy cigarettes as before.” [140 words]
Answers to Exercise 5
1 Two masked gunmen stormed a hotel in central London and tied up a staff member before making off with cash and mobile phones, police said.
The men, said to be speaking in eastern European accents and wearing white hoodies, burst in to the Dean Street Town House in Dean Street, Soho at about 03:00 BST.
They threatened staff with a long-barrelled gun and tied one man up before making off.
No shots were fired and no-one was injured at the four-storey hotel.
One person was treated for shock.
The hotel is popular with celebrities. Kate Moss, Anne Hathaway and Bryan Ferry are all said to have stayed there, and Gwyneth Paltrow cut the ribbon at its opening.
Det Supt Jess Ruddell said hotel staff had been left "very shaken" by the raid and urged witnesses to contact police.
"This is a very serious incident and we are working around the clock to identify those responsible," she said.
The 39 bedroom hotel is part of the Soho House Group chain, which owns a string of boutique hotels and private members clubs all over the world, including in New York, Hollywood and Berlin.
[193 words]
2 One of the world’s biggest motor companies is to produce a car that costs just $2,500.
Renault-Nissan has entered a joint venture with the Indian motorbike manufacturer Bajaj to produce the vehicle, which will be aimed largely at the Indian market.
The car, so far known only as Codename ULC, will cost roughly the same as another Indian cut-price vehicle – Tata Motors' Nano – which it claims is the world's cheapest car.
No details of the new car have been released, though production is expected to begin later this year.
Bajaj, the second-biggest maker of motorbikes in India, will manufacture 400,000 a year in a factory in Chakan, Maharashtra state, in the west of the country. [116 words]
3 Over six million children who die each year could be saved if they were given basic health services, according to a new report.
Save the Children carries out an annual survey of health care provision for the under fives in developing countries.
It found the Philippines was performing best with almost 69 per cent of children able to get health care.
In India and Ghana, less than half get the care they need.
Ethiopia ranks last - only 16 per cent of children under five get health care when they need it.
The report, called State of the World's Mothers, says that over 60 per cent of the 10 million children who die each year would live with basic health services provided by a health facility or community health worker.
A spokesperson for Save the Children said: "A child's chance of reaching its fifth birthday should not depend on the country or community where it is born.
"We need to do a better job of reaching the poorest children with basic health measures like vaccines, antibiotics and skilled care at childbirth.” [181 words]
16C4 Headlining news
Answers to Exercise 6
- 1
- Gun attack
- at hotel
- of the stars
- 2
- A new car
- for just
- £1,500
- 3
- 6m young
- lives ‘can
- be saved’
16C5 Subbing features
Tips for subbing features are included in this comprehensive subbing guide: www.journalism.co.uk/sub-editors/s105/
16C6 Headlining features
Tips on features headline writing are included at this overview of headline writing in general: www.columbia.edu/itc/journalism/isaacs/client_edit/Headlines.html
16C7 Sub-editing and Search Engine Optimisation
![]() In the book you’ll find a detailed guide to the principles and practise of Search Engine Optimisation.
In the book you’ll find a detailed guide to the principles and practise of Search Engine Optimisation.
Here are some links to build on what you learn in the book
SEO made easy
http://lifehacker.com/software/seo/getting-to-done-seo-made-easy-138429.php
An online SEO tutorial
http://homebusiness.about.com/od/yourbusinesswebsite/a/DIY_SEO_Tips.htm
A guide to SEO for bloggers
Using Google Adwords to generate keyword suggestions.
It doesn’t always prove very useful, but give it a try
https://adwords.google.com/select/KeywordToolExternal
Using Google Trends to spotlight popular searches
Improving SEO on your WordPress site
Change your permalink settings
First, what's a permalink? It's short for permanent link. This from Techterms' definition (http://techterms.com/definition/permalink), which says that a permalink "is a URL that links to a specific news story or web posting. Permalinks are most commonly used for blogs, which are frequently changed and updated. They give a specific Web address to each posting, allowing blog entries to be bookmarked by visitors or linked to from other websites."
Because a permalink remains unchanged indefinitely, links are much less likely to become broken.
WordPress’s default setting for Permalinks isn't an efficient URL structure for SEO. To improve things, go to Settings>permalinks in your dashboard and change the setting to Post Name (/%postname%/). WordPress says making this change: "can improve the aesthetics, usability, and forward-compatibility of your links".
It helps SEO by making it easier for Google to crawl your site, as they explain here: https://support.google.com/webmasters/answer/1235687?hl=en
Add Some Update Services
As Search Engine Watch says here: http://searchenginewatch.com/article/2262638/5-Basic-Tips-to-Improve-WordPress-for-SEO-and-the-User-Experience
"When new pages and posts are created it may take some time for that new URL to be indexed by search engines ... To speed this up, WordPress offer the chance for you to add update services within the General Settings page.
Go to Settings>writing and you should see that one, http://rpc.pingomatic.com/, is already listed, as this is the WordPress default. Search Engine Watch recommends adding these two:
http://blogsearch.google.com/ping/RPC2
This is good for SEO because you want your site properly indexed in order for your content to be findable. If a page isn't indexed, it won't show up in search results.
Search Engine Watch points out: "Not indexing quickly or often enough means your site could miss some big organic search opportunities, especially if your site relies on current affairs or breaking news."
Find more on this subject here: http://searchenginewatch.com/article/2262638/5-Basic-Tips-to-Improve-WordPress-for-SEO-and-the-User-Experience
Use Google Analytics
Finally, installing Google Analytics is in itself a boost for SEO. As that's the subject of a later section in this chapter, we'll leave discussion until then, except to say that having analytics on your site provides a wealth of data that shows you how long visitors stay on your site, which pages or posts are popular and which are not. It tells you how much traffic you get from search engines, and what device visitors are using. That tells you how important smartphone or tablet computer traffic is to you.
16C8 Proof-reading
In print journalism, a set of proof-reading symbols were traditionally used to indicate the changes that needed to be made to a proof. The symbols were essential when a printer, rather than a journalist, had to make the changes.
Since those days their use has declined, but they are still used in a large number of print publications and, to a lesser extent, in multimedia journalism.
You can see how they are used here:
www.cse.dmu.ac.uk/~bstahl/CORRECTION_MARKS.pdf
These links take you to further guidance on proof-reading, and proof-reading exercises, from a wide range of sources:
www.sfep.org.uk/pub/faqs/fproof.asp
www.mediatrust.org/training-events/training-resources/online-guides-1/Proofreading
16C9 Using Google Analytics
Signing up for Google Analytics and installing it on your WordPress site
Google Analytics will only work on Wordpress.org sites, not on .com. Go to the Google Analytics sign-up page at http://www.google.com/analytics/ and log in with your Google account.
You will be taken to the analytics sign-up page and asked for basic details in order to add analytics to your account. Once you've done that, you get the code that must be embedded in the site you want to track.
You'll find guidance on setting up tracking code here: https://support.google.com/analytics/answer/1008080?hl=en&topic=1008079&parent=1726910&rd=1
There are various plug-ins that will install analytics for you. You can search for them in the WordPress plug-in finder.
I use one called Google
Analytics: http://wordpress.org/extend/plugins/googleanalytics/
Another recommendation is called Google Analytics for WordPress, by Yoast. http://wordpress.org/plugins/wordpress-seo/
A third is called Insert Headers and Footers:
http://wordpress.org/extend/plugins/insert-headers-and-footers/
Once your chosen plug-in is installed you go to its settings page and add the code you have been given at Google Analytics. Then follow the instructions on clicking to verify the process has been completed successfully. It takes around 24 hours for your analytic data to begin to come through.
There are more details on the process here: www.wpbeginner.com/beginners-guide/how-to-install-google-analytics-in-wordpress/
How to use Google Analytics: audience overview
Log in to Analytics and click the Reporting tab and you are taken to Audience Overview.
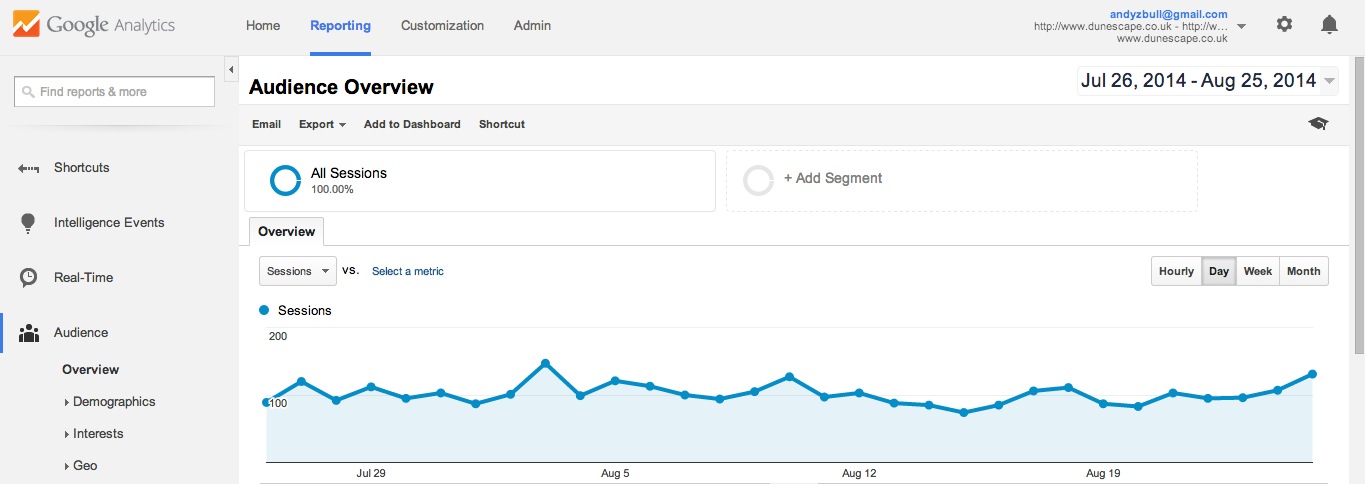
By default the overview period (shown above) is set at the past month, but you can change that by clicking the down arrow alongside the date-range box at top right of your screen. You can also compare the analysis period you choose with another period. So you could compare this month with last month, yesterday to today, or other periods you set.
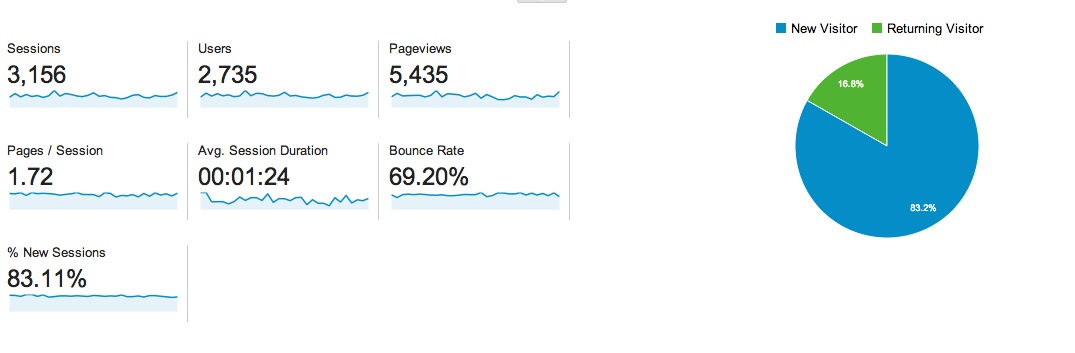
Scroll down and you'll see the statistical summary Analytics gives you:
You may want to monitor the site in real time, to see immediately how stories are being received, and you can do that by choosing Real Time from the left-hand nav. We'll look at that in more detail later.
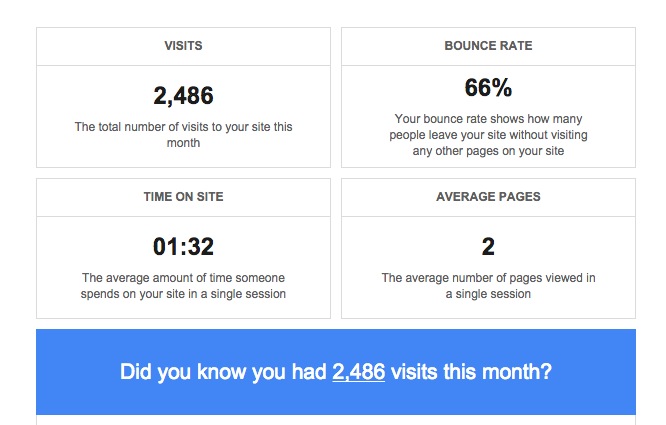
Here's what Google Analytics tells you
You get information on the total number of sessions; which are periods a user has been actively engaged with the site; number of users; total page views; number of pages viewed per visitor and the time they were viewed for. You also get the bounce rate, which is the percentage of visitors who went away a split second after they arrived.
The balance between new and returning visitors is a significant one. You want to see new visitors coming to you, because that shows you are reaching new people who could potentially become regular visitors. Repeat visitors are significant because these are people who liked what you gave them enough to come back for more.
Here are the trends you should be seeing if your site, and your journalism, are successful:
Unique visitors over time
You are looking for an upward trend. Compare uniques in different time periods, particularly periods in which you publish significant new content. Which stories were the most successful? Which didn’t work as well? You need to learn over time what content best fulfills the information needs of your community.
The percentage of new visits – just over 83 per cent for this site. What should the balance be between the two? On a new site you'll expect to see a high proportion of new visitors. As the site becomes established, you should see the balance shift towards repeats.
Another key metric is the number of pages viewed, which in this case is 5,435, and the number of pages viewed per visit, which is 1.72.
The higher this total number, the more successful you are at getting your news in front of people. The higher the number of pages viewed, the more you have persuaded them to stick around once they found you.
People who came to you to read one story and then left are a missed opportunity – you want to grab them, but we know that it's the nature of the web that people find one of your stories through search and may have little interest in you as a news source.
The average visit duration – 1.24m here – is another measure of how much your content engaged them.
The bounce rate – just over 69 per cent here – is the measure of what proportion of visitors left after viewing a single web page. Infact, as we'll see below, most stayed 10 seconds or less; not long enough to consume any news.
The average bounce rate for an established news site is around 40–60 per cent. As this is a new site I can hope to improve on my current rate.
More about your audience
In the navigation on the left you have options to explore your audience in more detail:
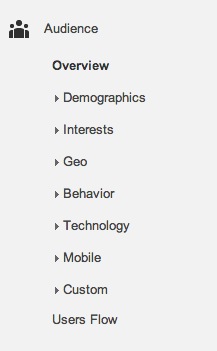
Under Demographics you get language and location.
Location is important to many news sites because it may show one or more heartlands with an interest in news from that region. Many UK-based websites have discovered large new audiences in North America, and developed content targeted directly at this market.
You may also see a surge in traffic from a particular region at different times of the day – from Japan and the Far East in their morning hours, another surge from the east coast of the USA, a third from the west coast, as each region wakes up and wants its news fix.
Behaviour
This gives you more on new-versus-returning, frequency-and-recency, and engagement. New-versus-returning is pretty much self-explanatory.
Frequency and recency
Frequency and recency is significant. It shows how many come once, twice, thrice and so on in the period.
How often should people come to you? Well, how often do you give them a reason to return? If you are a daily news site, do you have a healthy daily return? Websites allied to weekly or monthly publications often struggle to improve the frequency of visits, and need to build daily content that brings the brand in line with the nature of web publication rather than print.
Engagement
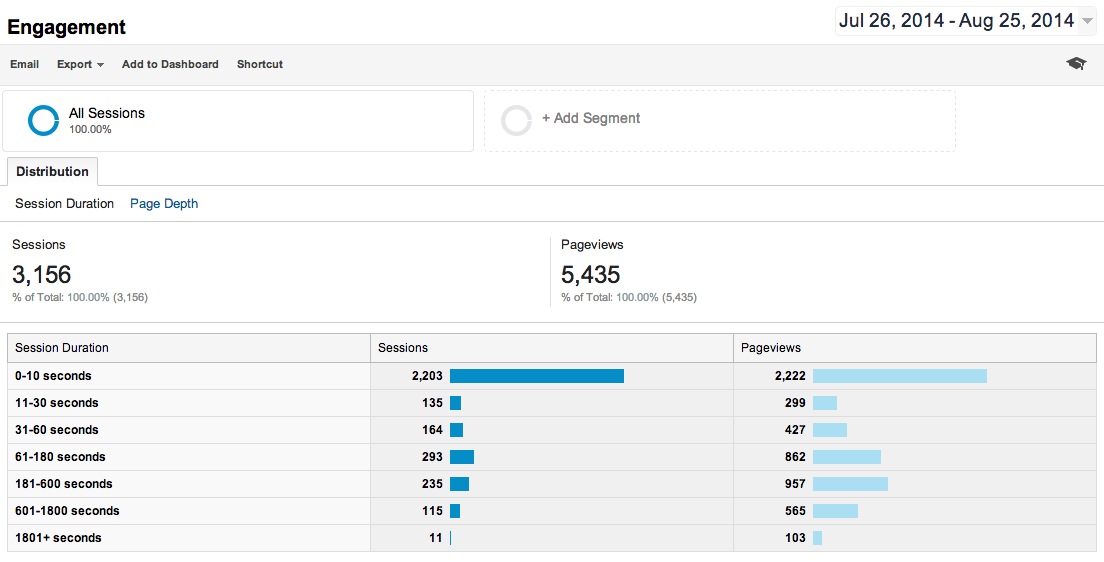
This is a much more detailed breakdown on how long visitors stayed with you. On this site, two thirds stayed less than 10 seconds, not long enough to read a news story. As you go down the list, you see far fewer stayed for a significant period, and a very few stayed and consumed a great deal.
Click on the Page depth tab and you see that 30 per cent of visitors to this website accounted for 70 per cent of page views. These are the people the journalists on that site should value. Google Analytics will reveal what these people looked at, and that will help the journalists identify what content engages with serious users of the site.
According to research ( www.mediabistro.com/10000words/the-journalists-guide-to-analytics_b875), the average visit to a news site is only one to two minutes. This is pretty clearly from visitors who have seen a link to a story, or found it in search results, and have come to read just that and then gone away again. We'll look at how to see the trigger for their visit later.
Really engaged members of your community will come back regularly. If you run a site with a large amount of fast-moving news, then you want to see a good proportion of visitors coming multiple times over a short period. News junkies might visit several times a day.
The days since last visit metric is also significant. How many repeat visitors come back daily? How many weekly? What are your goals for frequency of visits? If, for example, you are posting content daily, but a significant proportion of visitors are only coming back weekly, perhaps you need to adjust your strategy to cater for them by producing a weekly digest of news, with links to material published over the last seven days.
Engagement is measured by how long visitors spend on your site, and how many pages – Google Analytics calls this page depth – they visit when they are with you. What you are looking for is significant engagement which shows that visitors are consuming your material. Measuring it over time, and comparing engagement levels between significant content postings, can show you how effective your engagement is.
Technology
This tells you what browser and network your visitors are on, and is of value to site designers and usability teams.
Mobile
Tells you not only what percentage of visitors reached you via mobile, but also what specific devices they used. For this site, over 70 per cent of visits come from mobile devices.
We know that mobile users are different; they often want news or information about exactly where they are or what they are doing at a given moment. Are we serving such visitors well? Are they seeing our tweets about travel conditions during their commute?
On mobile devices, this site gets 31 per cent of visits via iPhones and 39 per cent via iPads, with a couple of percent from other brands of phone and tablet. Clearly, mobile visitors are collectively twice as important as those using desktop computers.
User Flow
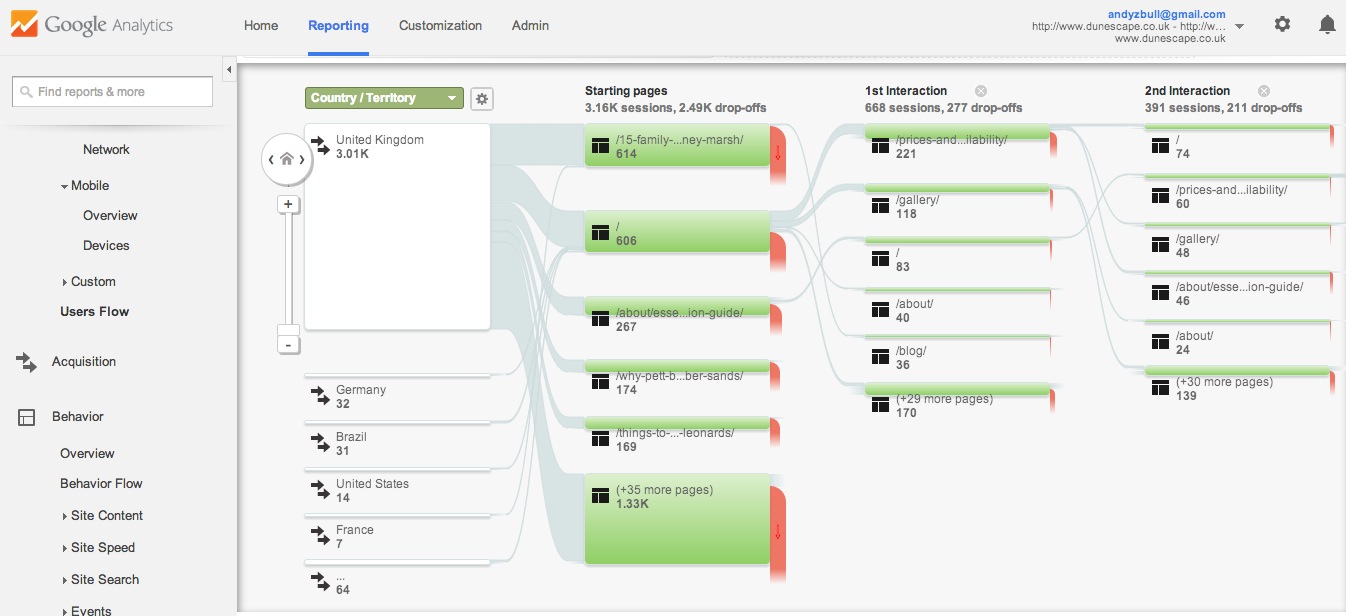
This graphic illustrates how visitors use the site. It shows the geographic region they come from, the pages on which they begin their visit to your site, when they leave – known as the drop off and represented with a red downward arrow at each departure point – and where those who stayed went next.
This is a good way of seeing what content is popular (more on that later) and how the site is used. On a news site you'll get a mix of people coming to your home page, or a particular news index, others coming to a specific story via a combination of means – from a tweet about it perhaps, or a link they've found somewhere.
Monitoring flow over time, and analysing the ways in which new content affects the flows, helps you see popular paths through the site and understand what visitors want from you, and where there are opportunities to improve retention; to see which pages are performing poorly in terms of keeping readers interested in you.
If a page that brings in a lot of visitors also has a high drop-off rate,that can indicate a problem with the content there. And if there is a large drop-off from a page which is designed to move readers on to a further page – perhaps a news digest page – that also needs examining.
Comparing the different places new and return visitors go can show you what works for each category.
How to use Google Analytics: traffic sources
Under the Acquisition link in the left-hand navigation you learn where your visitors came from. There are four sources of traffic to your site:
- Organic search
- Referral
- Direct
- Social.
Organic search traffic is people who found you on a search engine
Referral traffic comes via a link on another website
Direct traffic is people who have typed your URL into a browser, have you bookmarked, or have clicked on a link you supplied to them, perhaps in an email bulletin.
Social traffic comes from Twitter, Facebook, Google+, Pinterest etc.
You can get a breakdown of all the sources visitors came from, with indications alongside of whether these sources are organic, direct, referral or social. You can see what these visitors did when they got to your site: how many pages they visited, how long they stayed, how many were new visitors, and how many left immediately (the bounce rate).
Organic search dominates my top five traffic sources on the site I'm using to demonstrate Google Analytics, but I also have direct traffic, referrals from other websites that I have built up a relationship with, and traffic from my interactions on social media.
Referral traffic shows how successful your link building is on other websites.
Referrals are important because they are highly valued by search engines as indications that yours is a useful, reliable site, and hence they help your SEO.
You can also drill down to look at each of the four sources individually. So, for example, under Channels>organic search I can see which keywords brought the most visitors.
SEO
Note: You need to have Google's webmaster tools activated for this to work. This is a tall order for the non-techie, but to give this a go, you'll find details here: http://searchenginewatch.com/article/2273660/How-to-Use-Google-Webmaster-Tools-to-Maximize-Your-SEO-Campaign
Click Search Engine Optimisation in the navigation and you can see what is happening to your listing at the search engines.
For each specific query which brought you into search results, it tells you how many impression you got, your average position in the results, and your click-through rate. You really need a position in the first 10 on the results, as few searchers go beyond the first page of results. Such a position should give you a high number of impressions, which ought to give a good click-through rate, if you have got the wording within your listing right.
With major news stories and important areas of news there will be a huge amount of competition. With a small site the key is to specialise – either covering a subject, an industry, a location or some other clearly definable area of interest to web browsers.
If your site is local, or hyper-local, you should be scoring highly for search terms about the area you cover. If you are on a B2B title, you should show prominently in results for the industry you report on.
Keywords
Also on this screen you get the keywords used to find you. Some will have used the name of your website, others will have been looking for news on a particular topic. These are valuable, because you can see whether there are topics that are popular and for which you could create more content.
Under the search button you can see the keywords used in organic search.
Content
The Content section of Google Analytics – it's under Behaviour>site content – drills right down into your journalism. We got an overview before, but this section shows you how each individual page on your site is working. This is really valuable information that lets you identify well- and poorly-performing pages.
Popular pages are ones where you are achieving the most engagement, and are good places to put opportunities for people to engage with you further – so they are a good location for links to more content, opt-in forms for email bulletins, follow us on Twitter, contact-us forms and so on.
We see how many page-views each gets, how many unique visitors are drawn to them, and how much time they spend on them. It's at this level that you can see how your individual stories have fared. You can see those that were the most popular, and those that achieved the highest engagement – not always the same thing.
While it's clear that pages with high traffic are important to your success, you should also look for pages that get a lower traffic but where those that do come spend more time.
For example, the main news page on my site got 623 views, with an average time spent there of 1m4s, but one news story got 44 views with a time spent of 3m18s. Those stats suggest that this story only appealed to a minority of site visitors, but those who liked it, liked it a lot.
Landing pages
A landing page, in Google Analytics terms, is the first page a visitor sees at your site. Often that's the home page, but it can be any other page which brings them to you.
The list of these gives another indicator of the means by which you've hooked the visitor, and is another indicator of successful content.
The top 10 landing pages for this site have the home page at the top, the next nine are individual stories, in descending order of popularity.
Site speed
You want your site to load quickly – any delay and some visitors will just go elsewhere. An average response time of 1 to 2 seconds is desirable, with a page load time ideally of 10 seconds or below. This tool shows you whether you are achieving it. Google Analytics will break the response down by the browsers that visitors were using.
You may notice some spikes in page load times; odd days over a month when it took a good deal more than 10 seconds for pages to load. You can trouble-shoot by clicking on page timings to try to identify pages that are loading slowly for some reason. Perhaps a picture has not been compressed.
Content experiments
Google Analytics lets you experiment to see if you can improve the performance of pages within your site. Go to the Experiments tab and you can create up to six variants on a particular page and paste the URLs into the experiments interface. You can change the look, the headline, the images and any other element you fancy.
Here’s a video explaining it http://youtu.be/TGrujIh2H0I
Setting goals
Google Analytics also allows you to set goals for improving your engagement with your visitors. Goals reports are found under the Conversions tab. Examples of goals are visit duration or number of pages visited. You can collect data on how successful you are in achieving them.
Here's some advice from Mashable (http://mashable.com/2012/01/04/google-analytics-guide/) on how to use goals: “The goals area is where your data tracking can really help you make a difference. These outcome-oriented metrics help you dive deeper into your site performance and learn whether you’re achieving what you want with your website."
Mashable also says that your first step should be to define your business objectives. Do you aim to have visitors view a specific piece of content? Do you want more newsletter signups? Once you’ve established the goals of your site, and your site administrator has enabled Goals in Google Analytics in the Account Settings page, you can choose one of four types of goal to track. These are:
- URL destination: This is the best metric to use if your goal is to get visits to a key page of your site, such as your homepage or a post-purchase message page.
- Time on Site: If you want to measure the level of engagement your audience has with your site, this goal will track visitors spending a set period of time on your site.
- Pages per Visit: This metric is also important as a measure of engagement. You set the number of pages you want your visitors to see on average, and then see how you are doing.
- Events: Event goals let you track specific actions visitors take on a page. That could be anything rom downloading a PDF to watching a video.
In-page analytics
This brings up the page on your site you want to examine and overlays it with percentages of visitors who clicked on a particular link. That’s a great way of seeing which calls to action are working and which are not, without having to wade through a load of figures.
How to use Google Analytics: Real-Time data
Real-Time data gives you what is happening on your site right now
Here's what Google says about this feature:
“Real-Time allows you to monitor visitor activity as it happens on your site. The reports are updated continuously and each page view is reported seconds after it occurs on your site. For example, you can see:
- how many people are on your site right now
- their geographic locations
- the traffic sources that referred them, and
- which pages they're viewing.
“With Real-Time, you can immediately and continuously monitor the effects that new campaigns and site changes have on your traffic." Here are a few of the ways you might use Real-Time:
- monitoring whether new and changed content on your site is being viewed
- monitor the immediate effects on traffic from a blog/social network post or tweet
Under the overview tab you get
- the number of active users currently on your site
- page views per minute (over the past 30 minutes) and per second (over the past minute)
- top referrals
- top active pages
- top keywords
- top locations.
Under locations you get active visitors on your site, with top countries specified, and top cities listed and mapped. You can also see all countries mapped.
Under traffic sources you see how much of your traffic is organic, direct or referral. Sources for organic and referral traffic are specified.
Under content you get active pages – ones that are being read right now.
What you can do with this information
If you are a reactive news site you can see what is popular right now and give people more of it. If you see that one item on your news list is attracting a lot of interest, that's the one to put your reporting resources behind.
Try it out
With Real-Time open on your screen, post new content on your site and promote it on social media. See how many visitors come and how they behave.
A summary of your analytics
Google will send you summaries of your analytics, giving you a snapshot of how your site is performing.
16C10 Analytics tools on Twitter, Facebook, YouTube and other social media platforms
Twitter analytics
Read about Twitter analytics here: https://analytics.twitter.com/about
Here's a guide to the latest version and what it can tell you: https://blog.twitter.com/2014/new-tweet-activity-dashboard-offers-richer-analytics
Facebook analytics
Facebook calls them 'insights'. Here's their explanation of what they can tell you:
www.facebook.com/help/search/?q=insights
Here's a Social Media Examiner Guide to how to use them: www.socialmediaexaminer.com/new-facebook-insights/
YouTube analytics
Here's their guide: https://support.google.com/youtube/answer/1714323?hl=en
Here's a Shopify guide to what you should be looking for www.shopify.co.uk/blog/6763696-youtube-analytics-10-ways-to-track-video-performance
Pinterest analytics
Here's their guide to what you can learn: https://analytics.pinterest.com/
Here's a guide from Mashable http://mashable.com/2014/08/26/pinterest-analytics-business/
Whatever social media platform you are using, find out what analytics it offers and use them to improve your content on the site.