Figures
eFigure 1.3
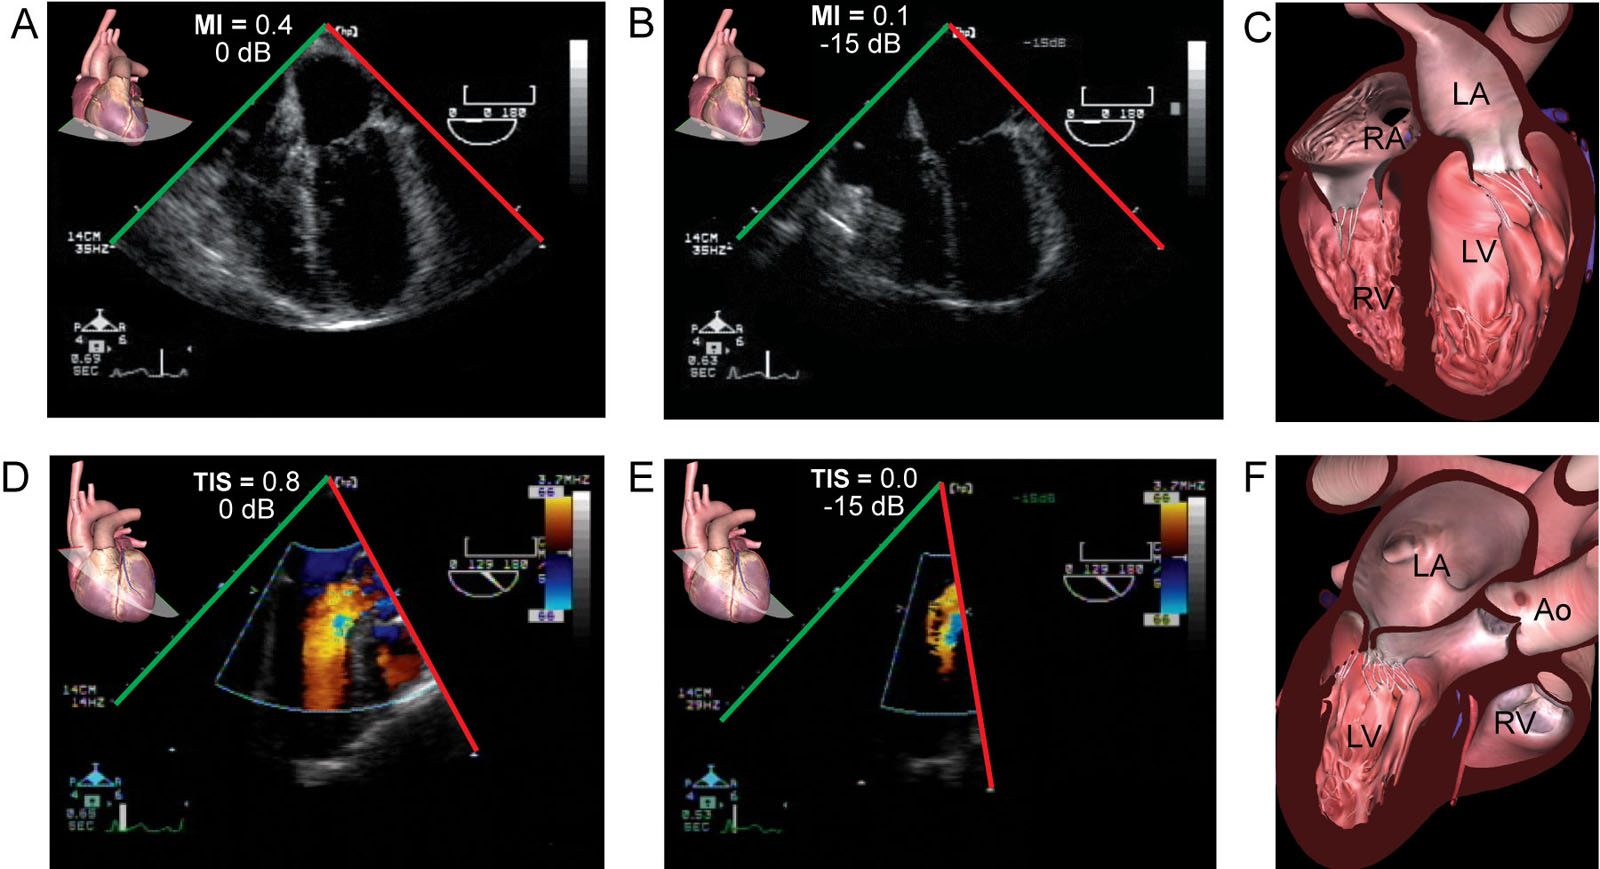
Transmitting power and indices. ME 4C (A–C) and ME long-axis color Doppler (D–F) views show (A, D) transmitting power in decibels (dB). A value of 0 dB specifies the emitting source is at 100% of its power. (B, E) Reduced transmitting power results in negative dB, and both the mechanical index (Ml) and the soft tissue thermal index (TIS) decrease. Abbreviations: 4C, four chamber; Ao, aorta; LA, left atrium; LV, left ventricle; ME, mid-esophageal; RA, right atrium; RV, right ventricle.
eFigure 1.13
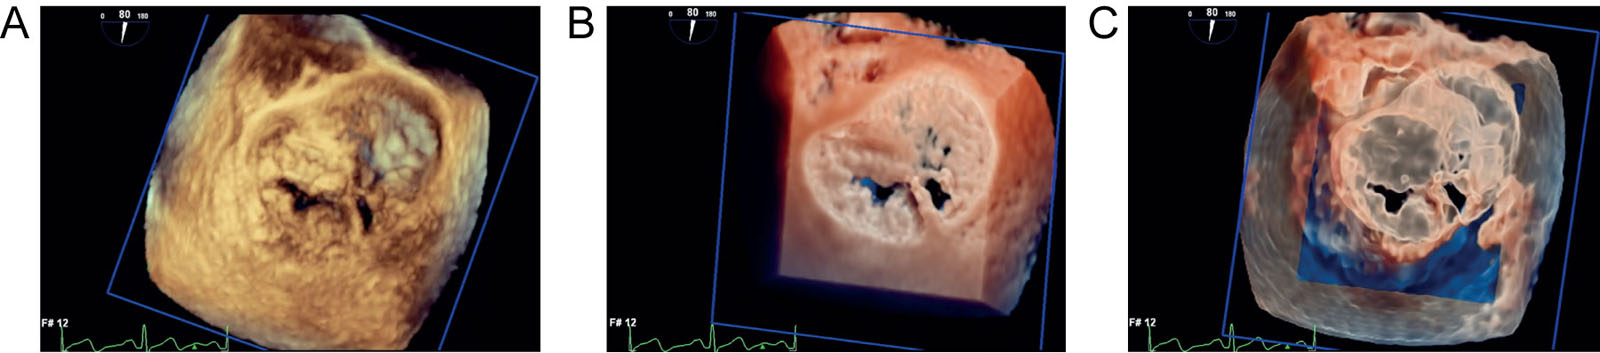
3D image displays. Conventional 3D rendering uses shading techniques to encode voxels based on their distance, grey-level gradient, and texture to generate a display of cardiac structures in 3D. Computer-generated lighting uses shadowing, transparency and opacity effects to create the depth perception. Shown is a 3D dataset of a mitral valve P2 prolapse on a 2D display using different options, such as (A) standard mode, (B) TrueVue® (Philips, Andover, MA) and (C) TrueVue Glass® (Philips, Andover, MA). Abbreviations: 2D, two-dimensional; 3D, three-dimensional
eFigure 1.14
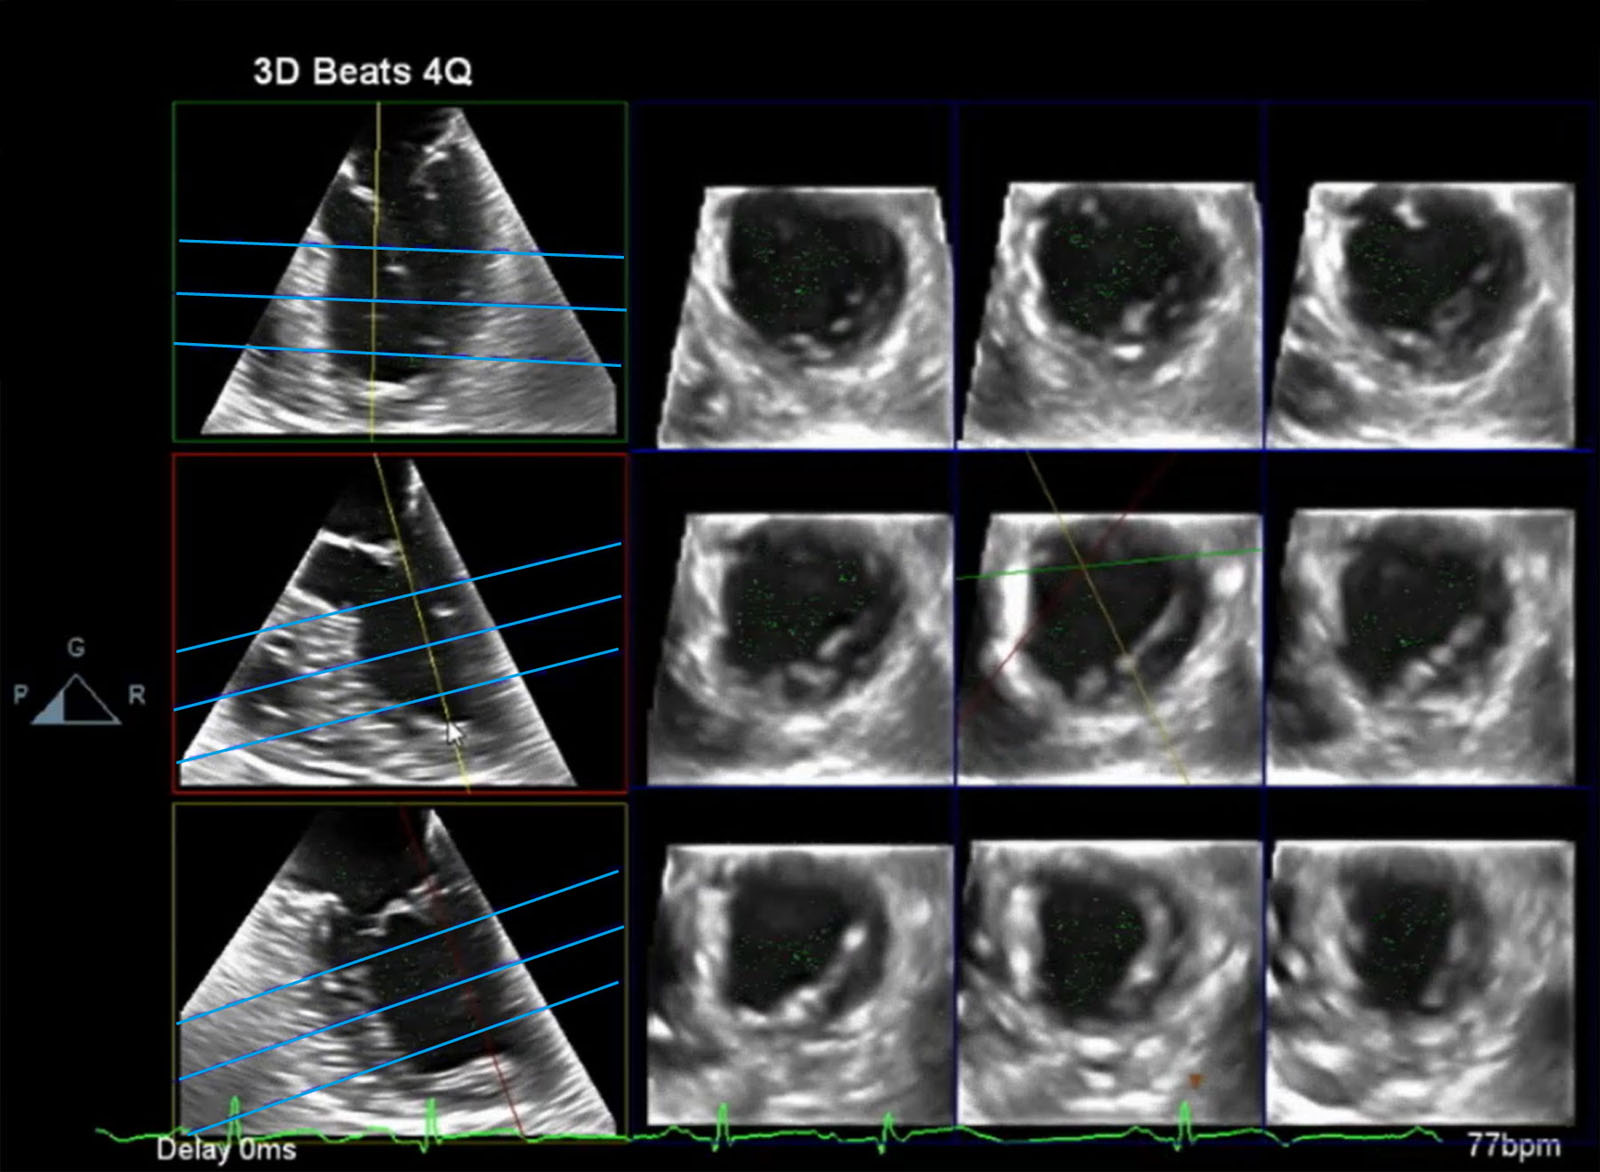
Multi-slice image display. The multi-slice display option cuts a 3D dataset to show multiple 2D images on a single display. Shown is a full volume 3D dataset from a ME 4C view with reconstruction of 2D SAX views at multiple levels. This display option allows the rapid evaluation of RWMA as after coronary revascularisation. Abbreviations: 2D, two-dimensional; 3D, three-dimensional; 4C, four-chamber; ME, mid-esophageal; RWMA, regional wall motion abnormalities; SAX, short-axis.
eFigure 1.16
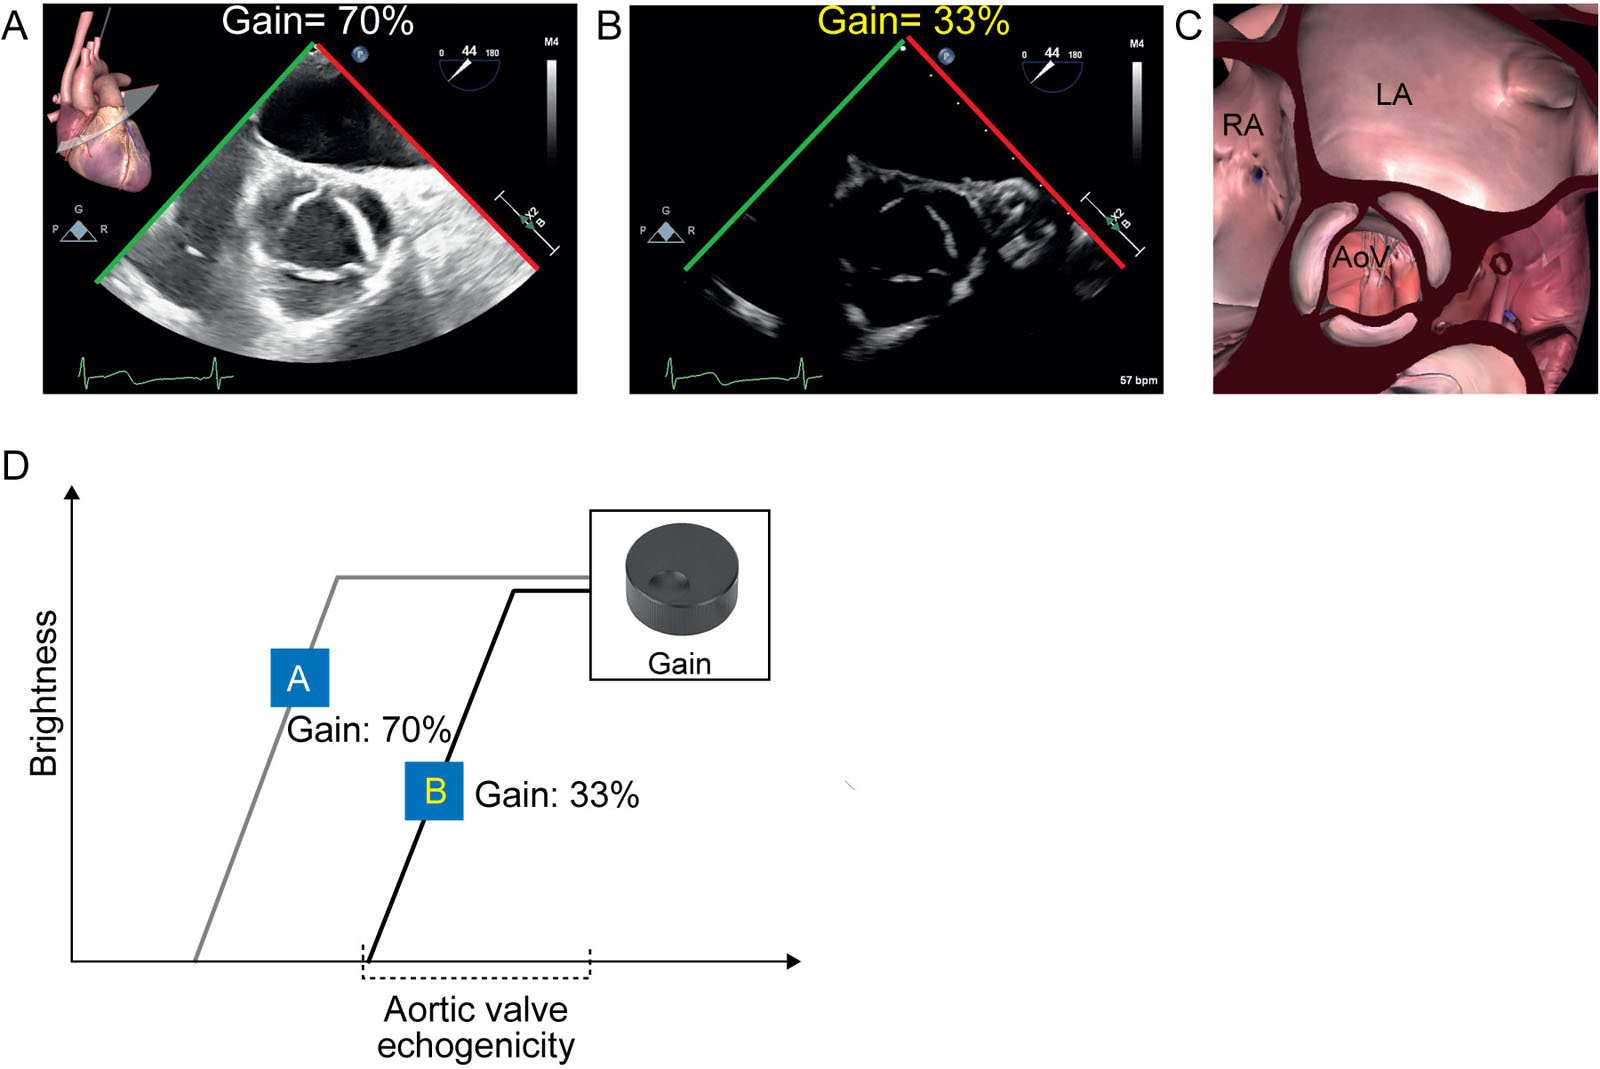
Overall gain control. (A-C) ME AoV short-axis view showing the effect of varying gain on the visual quality of the image by comparing (A) the gain of 70% with (B) the lower gain of 33%. (D) Relationship between brightness and AoV echogenicity, which represents the strength of the reflected signal from a given location in the patient. Higher gain value means that weaker signals (left of the x-axis) are given a high brightness. With a gain of 70%, the signal of most of the AoV is saturated (white), while a gain of 33% offers more contrast, the slope being located horizontally within the AoV echogenicity range in the image as represented by the figure. Echo signals below the chosen minimal threshold will appear as black pixels, while those exceeding the maximal range will appear uniformly as dense white pixels. Adjusting total gain changes the position of the center of the slope relative to the available range enhancing brightness within that range. Abbreviations: AoV, aortic valve; LA, left atrium; ME, mid- esophageal; RA, right atrium.
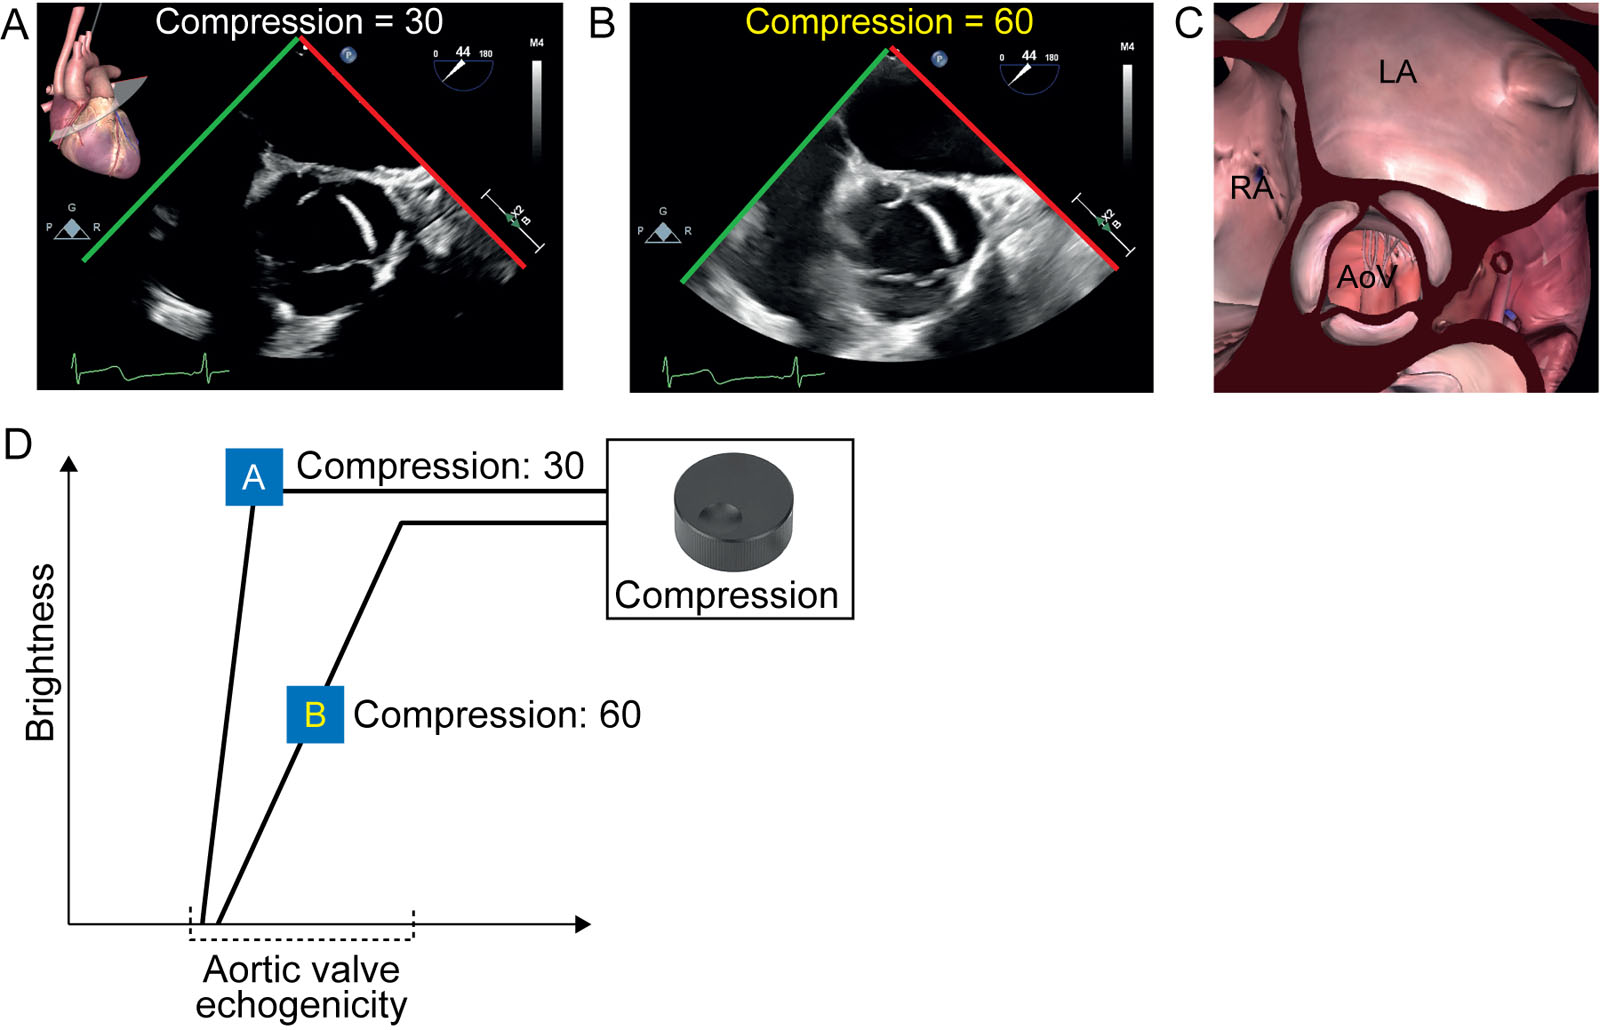
eFigure 1.17
Dynamic range compression. (A-C) ME AoV short-axis views show the effect of varying compression adjustments on the visual quality of the image by comparing (A) the compression of 30 with (B) the higher compression at 60. (D) Any echogenicity (x axis) value smaller than the value of the foot of the slope, or greater than the value under the top of the slope will not be visualized as they will appear black or white, respectively. However, all image areas that have an echogenicity value that fall directly under the slope on the x axis are adequately visualized, as they have a different brightness (y axis) value than other image areas of different echogenicity. Therefore, a dynamic range compression of 30 corresponds to a narrower range of echogenicity being adequately visualized, while a value of 60 will allow for a wider range of echogenicity being adequately visualized. These settings correspond to a narrower and a wider dynamic range, Abbreviations: AoV, aortic valve; LA, left atrium; ME, mid-esophageal. RA, right atrium.
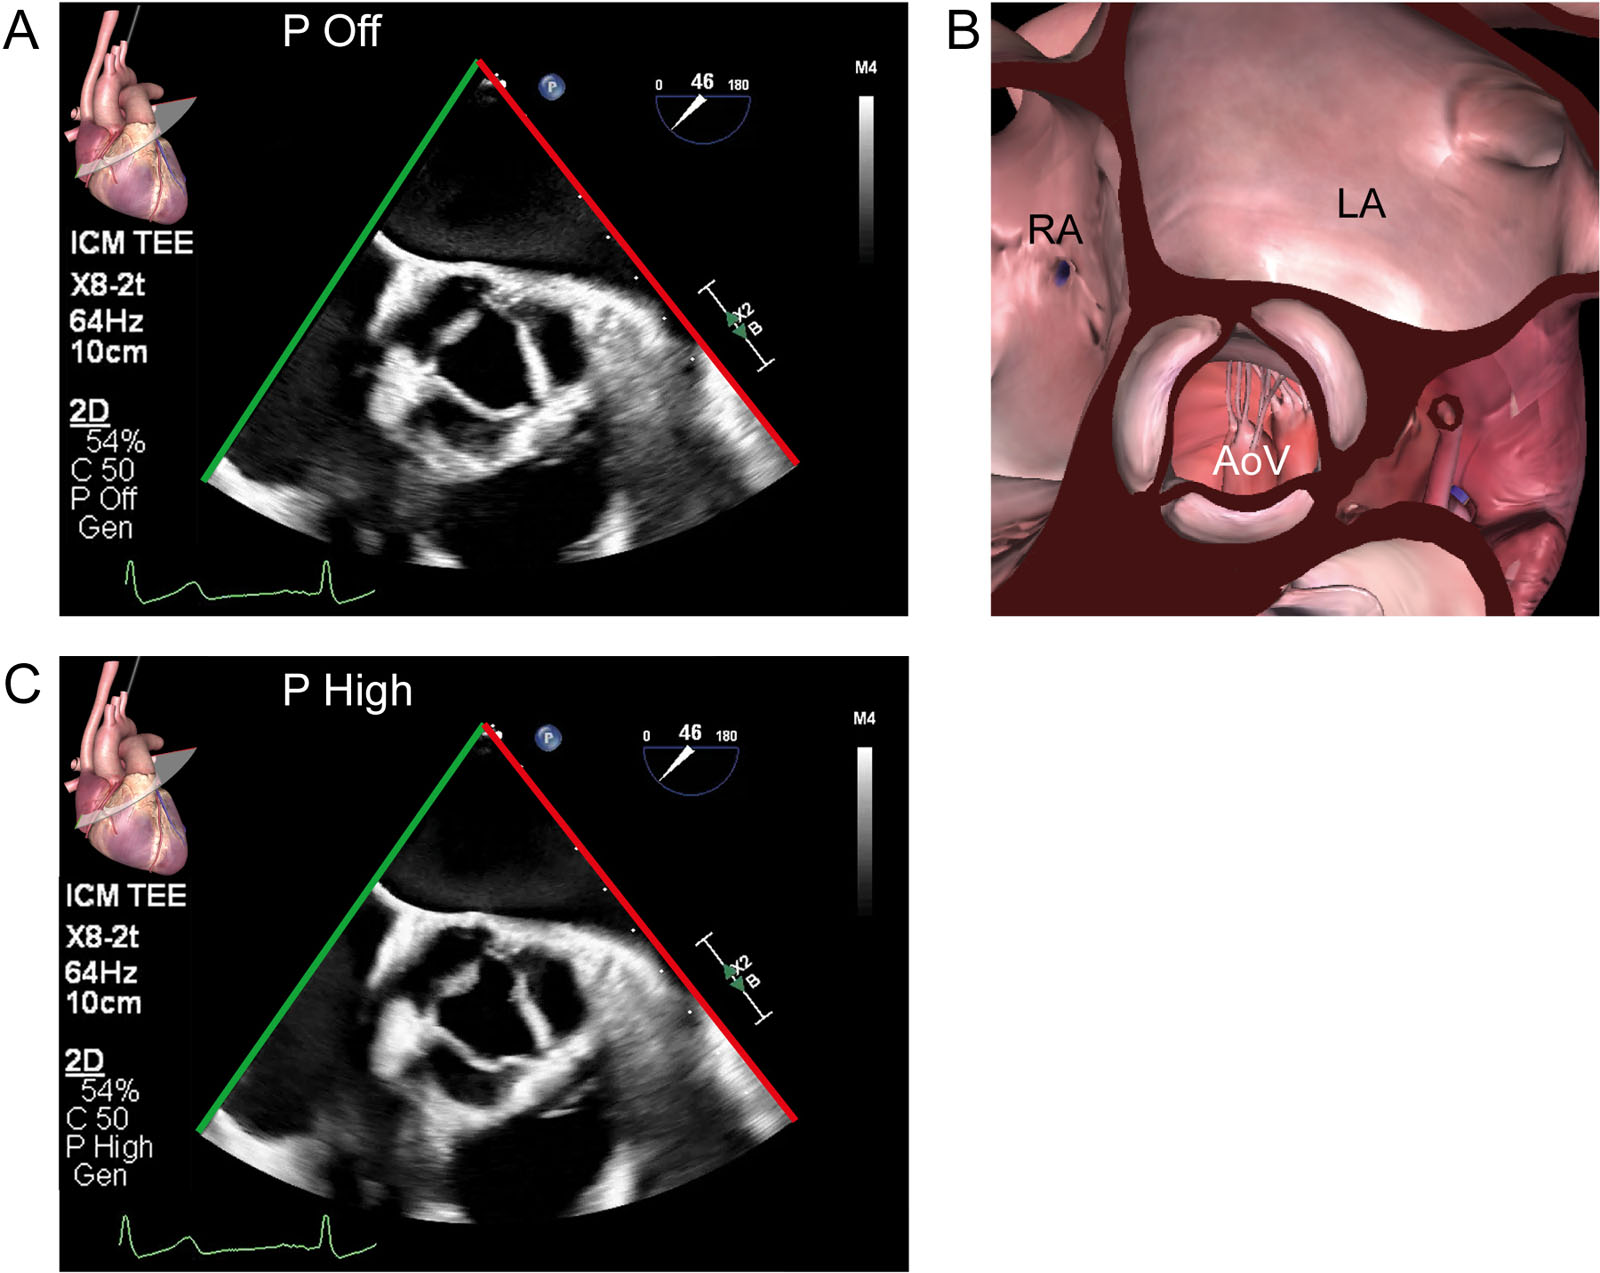
eFigure 1.21
Persistence. (A–C) Digital post-processing can substantially affect the image appearance of these ME AoV SAX views. Persistence (P) defines how much of the previous image appears in the current frame. The averaging of successive frames reduces the variations in the image between frames, so the image appears smoother (C) but with lower temporal resolution. The frame rate at 64 HZ is not altered. Abbreviations: AoV, aortic valve; C, compression; Gen, general; LA, left atrium; ME, mid-esophageal; RA, right atrium; SAX, short-axis.
Videos
Chapter 01 Fig02ABCDE
Chapter 01 Fig03AB
Chapter 01 Fig03DE
Chapter 01 Fig05A
Chapter 01 Fig09B
Chapter 01 Fig09E
Chapter 01 Fig10A
Chapter 01 Fig10B
Chapter 01 Fig11
Chapter 01 Fig12A
Chapter 01 Fig12D
Chapter 01 Fig13A
Chapter 01 Fig13B
Chapter 01 Fig13C
Chapter 01 Fig14
Chapter 01 Fig15ABDE
Chapter 01 Fig16A
Chapter 01 Fig16B
Chapter 01 Fig17A
Chapter 01 Fig17B
Chapter 01 Fig19A
Chapter 01 Fig19B
Chapter 01 Fig19C
Chapter 01 Fig20A
Chapter 01 Fig20C
Chapter 01 Fig21A
Chapter 01 Fig21C
Tables
eTable 1.1 Parameters for describing waves
Parameters |
Symbol |
Basic units |
Units |
Mainly determined by |
Amplitude |
A |
Pressure or density |
N/m2, Pa or g/cm3 |
Source and medium |
Frequency |
f |
1/Time |
Hz, MHz, sec–1 |
Sound source |
Intensity |
I |
Power/area |
W/m2 |
Sound source |
Period |
τ |
Time |
sec, μsec |
Sound source |
Power |
P |
Work/time |
J/sec, W |
Sound source |
Pressure |
P |
Force/area |
N/m2, Pa |
Source and medium |
Propagation speed |
c |
Distance/time |
m/sec |
Medium |
Wavelength |
λ |
Distance |
m, cm, mm |
Source and medium |
eTable 1.2 Ultrasound properties of common materials
Material |
Density (g/cm3) |
c |
Z |
Attenuation Coefficient |
Air |
0.0000012 |
331 |
0.0004 |
12 |
Fat |
0.95 |
1450 |
1.38 |
0.63 |
Muscle |
1.1 |
1580 |
1.70 |
0.5–1.0 |
Skull bone |
1.91 |
4080 |
7.80 |
20 |
Abbreviations: c, speed of sound; dB, decibel; Z, acoustic impedance, which is the product of density and speed of sound. |
||||
eTable 1.3 Relative ultrasound intensity changes for decibel (dB) values
| dB | Relative Intensity |
–40 |
0.0001 |
–30 |
0.001 |
–20 |
0.01 |
–10 |
0.1 |
–3 |
0.5 |
–2 |
0.63 |
–1 |
0.79 |
0 |
1.0 |
Note that a reduction of –10 dB and –3 dB means that a reduced intensity by one-tenth and one-half, respectively. |
|
eTable 1.4 Parameters describing pulsed ultrasound
| Parameters | Basic units |
Units |
Determined by |
Common values |
Pulse repetition period |
Time |
sec, ms, μsec |
Sound source |
0.1–1.0 ms |
Pulse repetition frequency |
1/Time |
sec–1, Hz |
Sound source |
1–10 kHz |
Pulse duration |
Time |
sec, ms, μsec |
Sound source |
0.5–3.0 μsec |
Duty factor |
None |
None |
Sound source |
0.001–0.01 |
Spatial pulse length |
Distance |
mm, cm |
Source and medium |
0.1–1.0 mm |