Figures
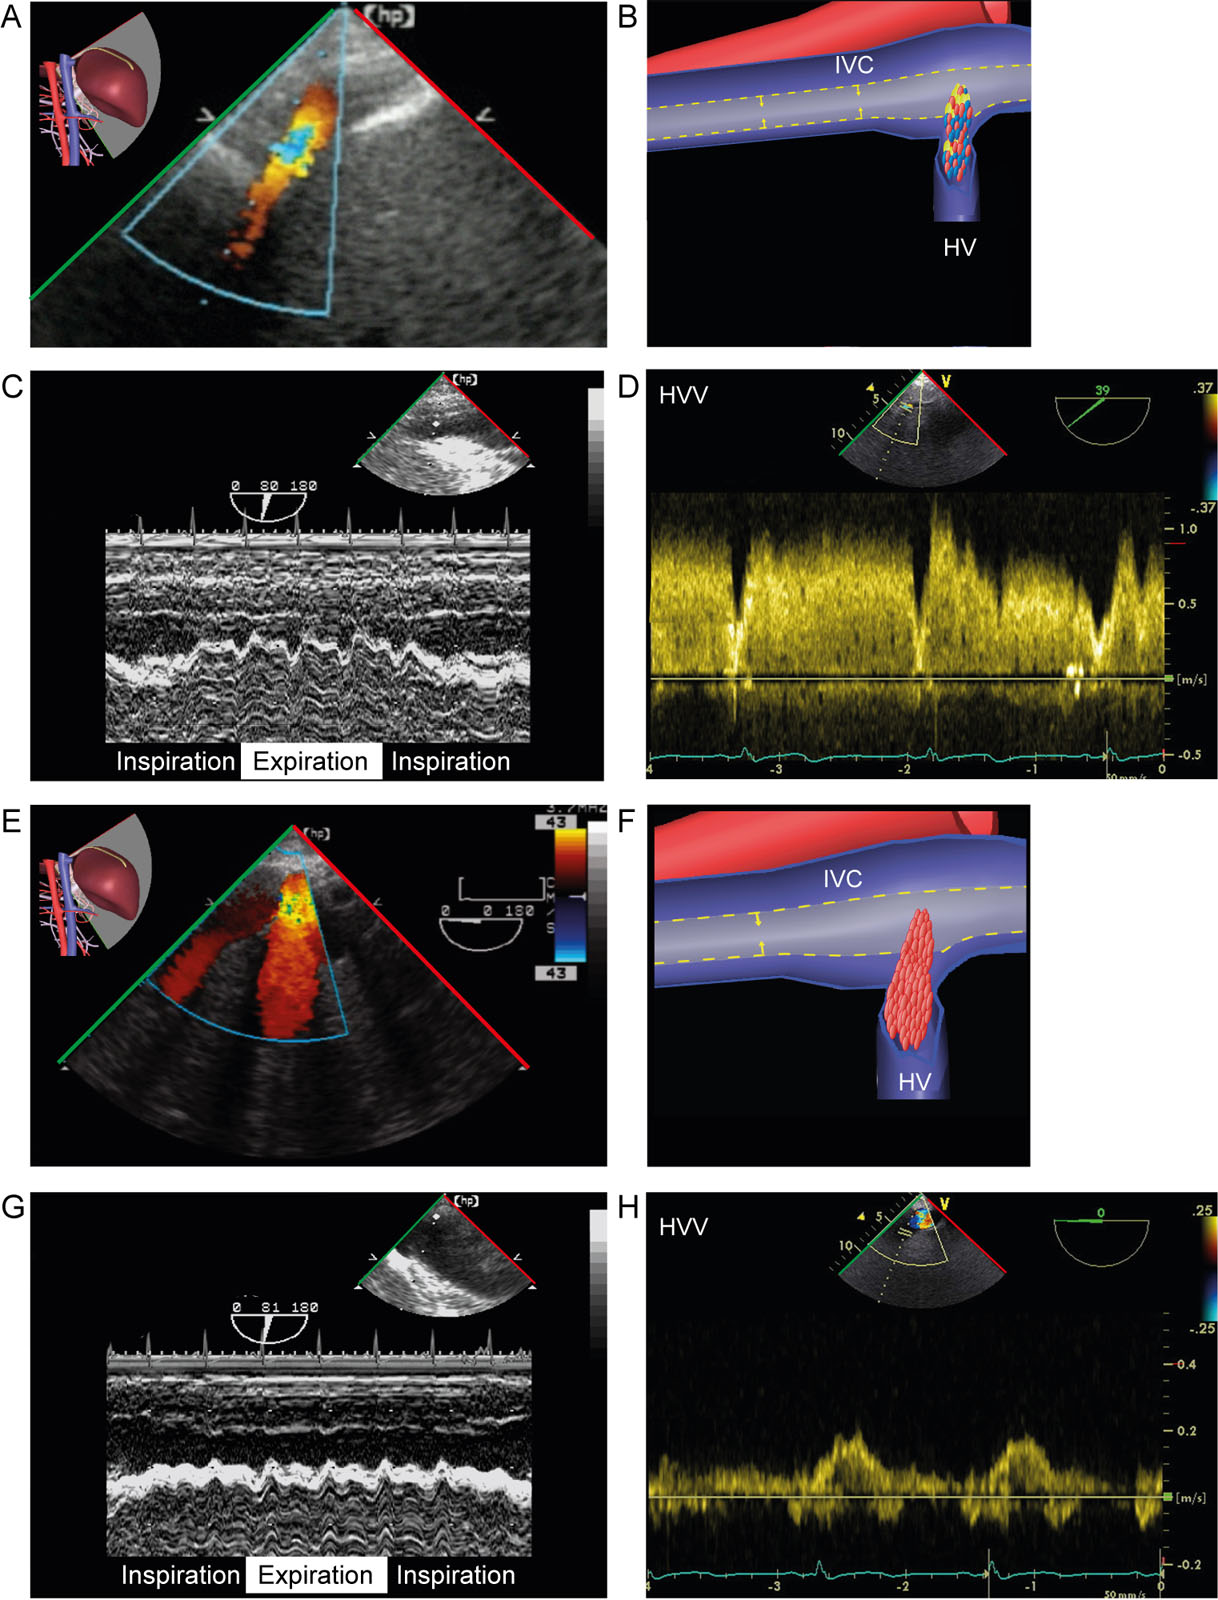
eFigure 10.11
Preload reduction. (A, B) TGAUS LAX IVC view with CFI shows reduced preload from hypovolemia as evidenced by both a reduced size of the IVC and hepatic veins, as well as (C) collapse during expiration while supported on mechanical ventilation using M-mode and (D) elevated HVV by PWD. (E-H) Following a fluid challenge both (E, F) the size of the IVC and hepatic veins enlarge, (G) IVC collapsibility decreases on M-mode and (H) the HVV normalizes. Abbreviations: CFI, color flow imaging; HV, hepatic vein; HVV, hepatic vein velocities; IVC, inferior vena cava; LAX, long-axis; PWD, pulsed-wave Doppler; TGAUS, transgastric abdominal ultrasound.
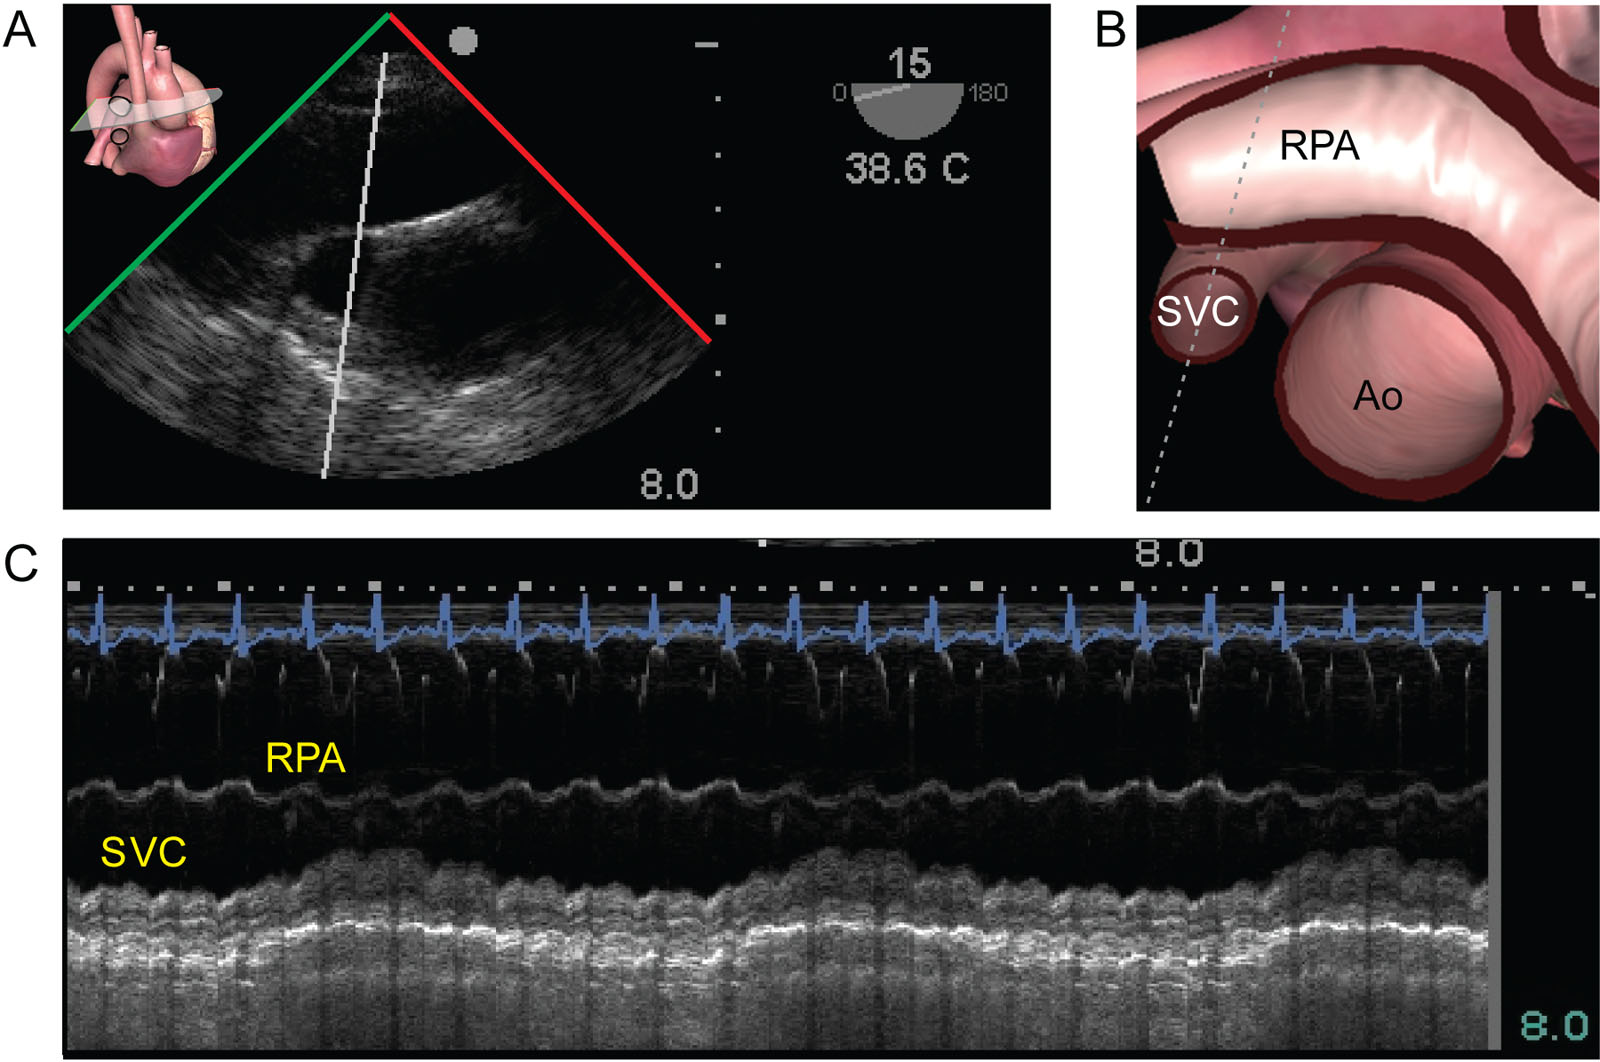
eFigure 10.12
SVC respiratory variations. (A,B, C) ME ascending aorta SAX view in a patient in the intensive care unit after the removal of 1.8 liters using dialysis shows significant respiratory variation of the SVC. Using M mode, phasic variations of the diameter of the SVC can be objectified. Abbreviations: Ao, aorta; ME, mid-esophageal; RPA, right pulmonary artery; SAX, short-axis; SVC, superior vena cava.
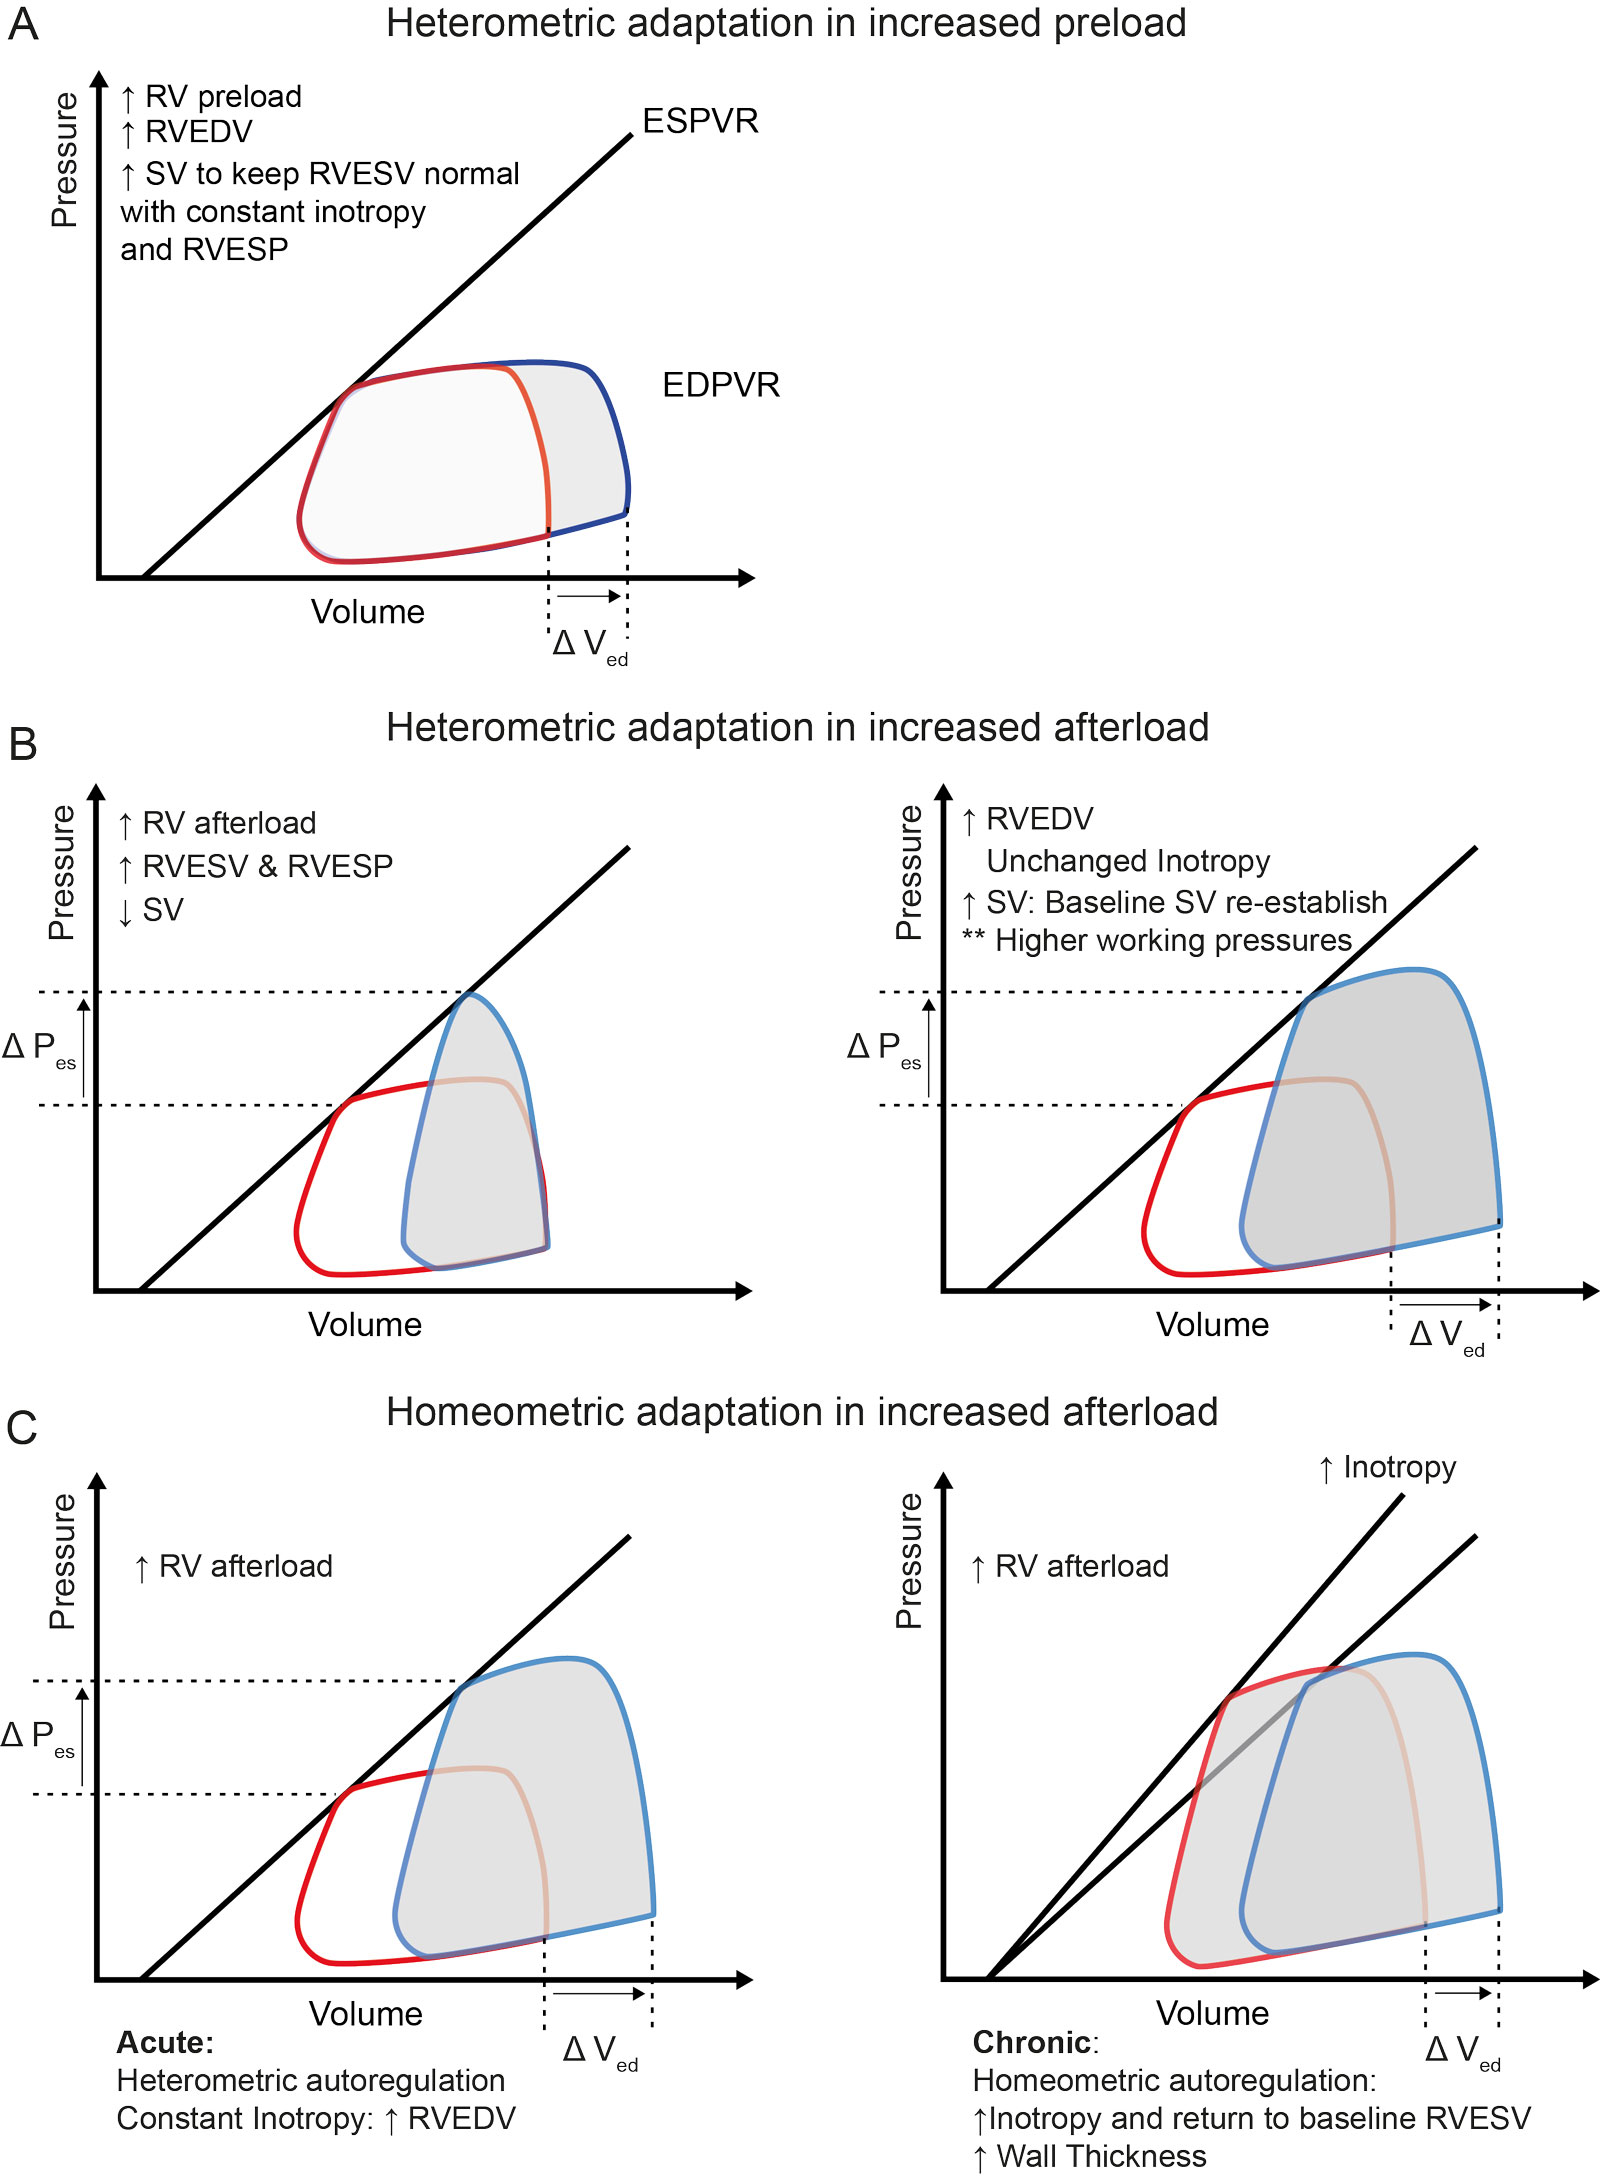
eFigure 10.14
RV adaptative mechanisms. This figure comprises pressure-volume loops demonstrating RV adaptive mechanisms to changes in loading conditions. (A) Increased RV preload results in heterometric adaptation, as the increase in RVEDV will increase SV to keep RVESV constant and maintain inotropy. (B) In the situation of increased RV afterload or RVESP, if stroke work and inotropy are constant, RVESV increases, which reduces SV. Heterometric adaptation is responsible for increasing RVEDV to reestablish SV and keep inotropy unchanged. (C) Homeometric adaptation mechanisms occur in reaction to increases in RV afterload. In this situation, an increase in inotropy (Anrep effect) counters the SV reduction to bring RVESV to its baseline level. Chronic homeometric autoregulation explains RV hypertrophy in patients with chronically elevated RV afterload. Abbreviations: DVed, change in end-diastolic volume; DPes , change in end-systolic pressure; EDPVR, end-diastolic pressure volume relationship; ESPVR, end-systolic pressure volume relationship; P, pressure; RV, right ventricular; RVEDV, right ventricular end-diastolic volume; RVESP, right ventricular end systolic pressure; RVESV, right ventricular end systolic volume; SV, stroke volume; V, volume. Adapted from Bellofiore et al. 43
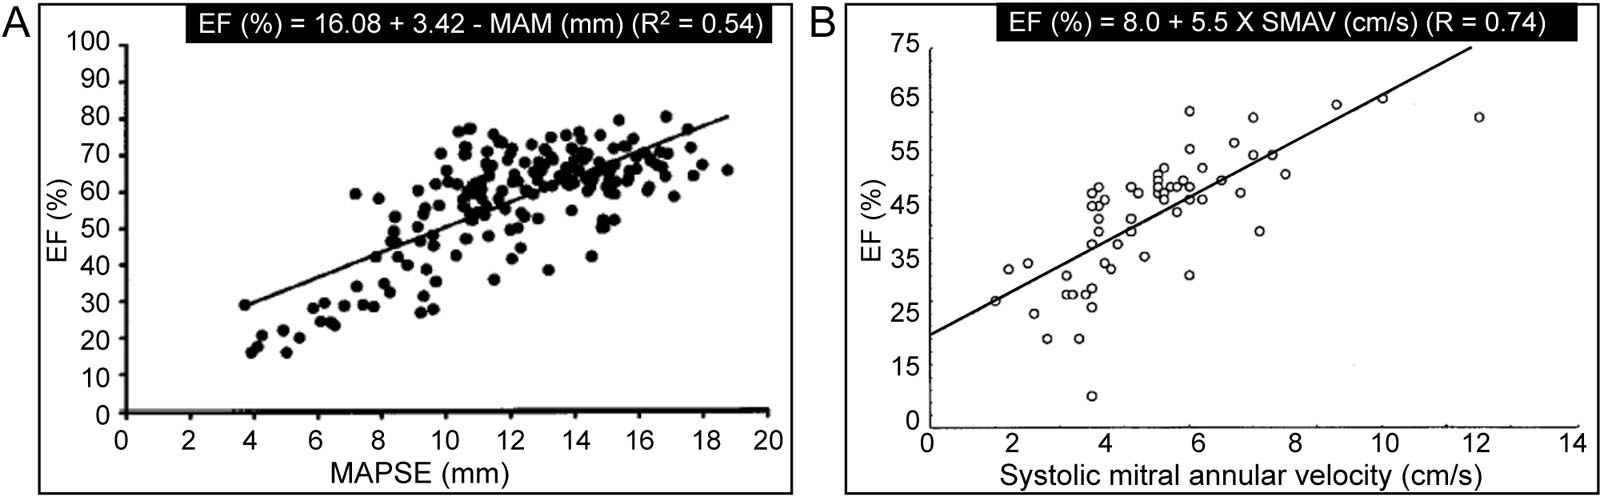
eFigure 10.15
LV function indices. These scatter plot graphs show the relationship between LVEF, MAPSE and SMAV. Abbreviations: EF, ejection fraction; LVEF, left ventricular ejection fraction; MAM, mitral annular motion; MAPSE, mitral annular plane systolic excursion; R, correlation coefficient; SMAV, systolic mitral annular velocity. Source: Adapted with permission from Emilsson 319 and Alam et al. 320
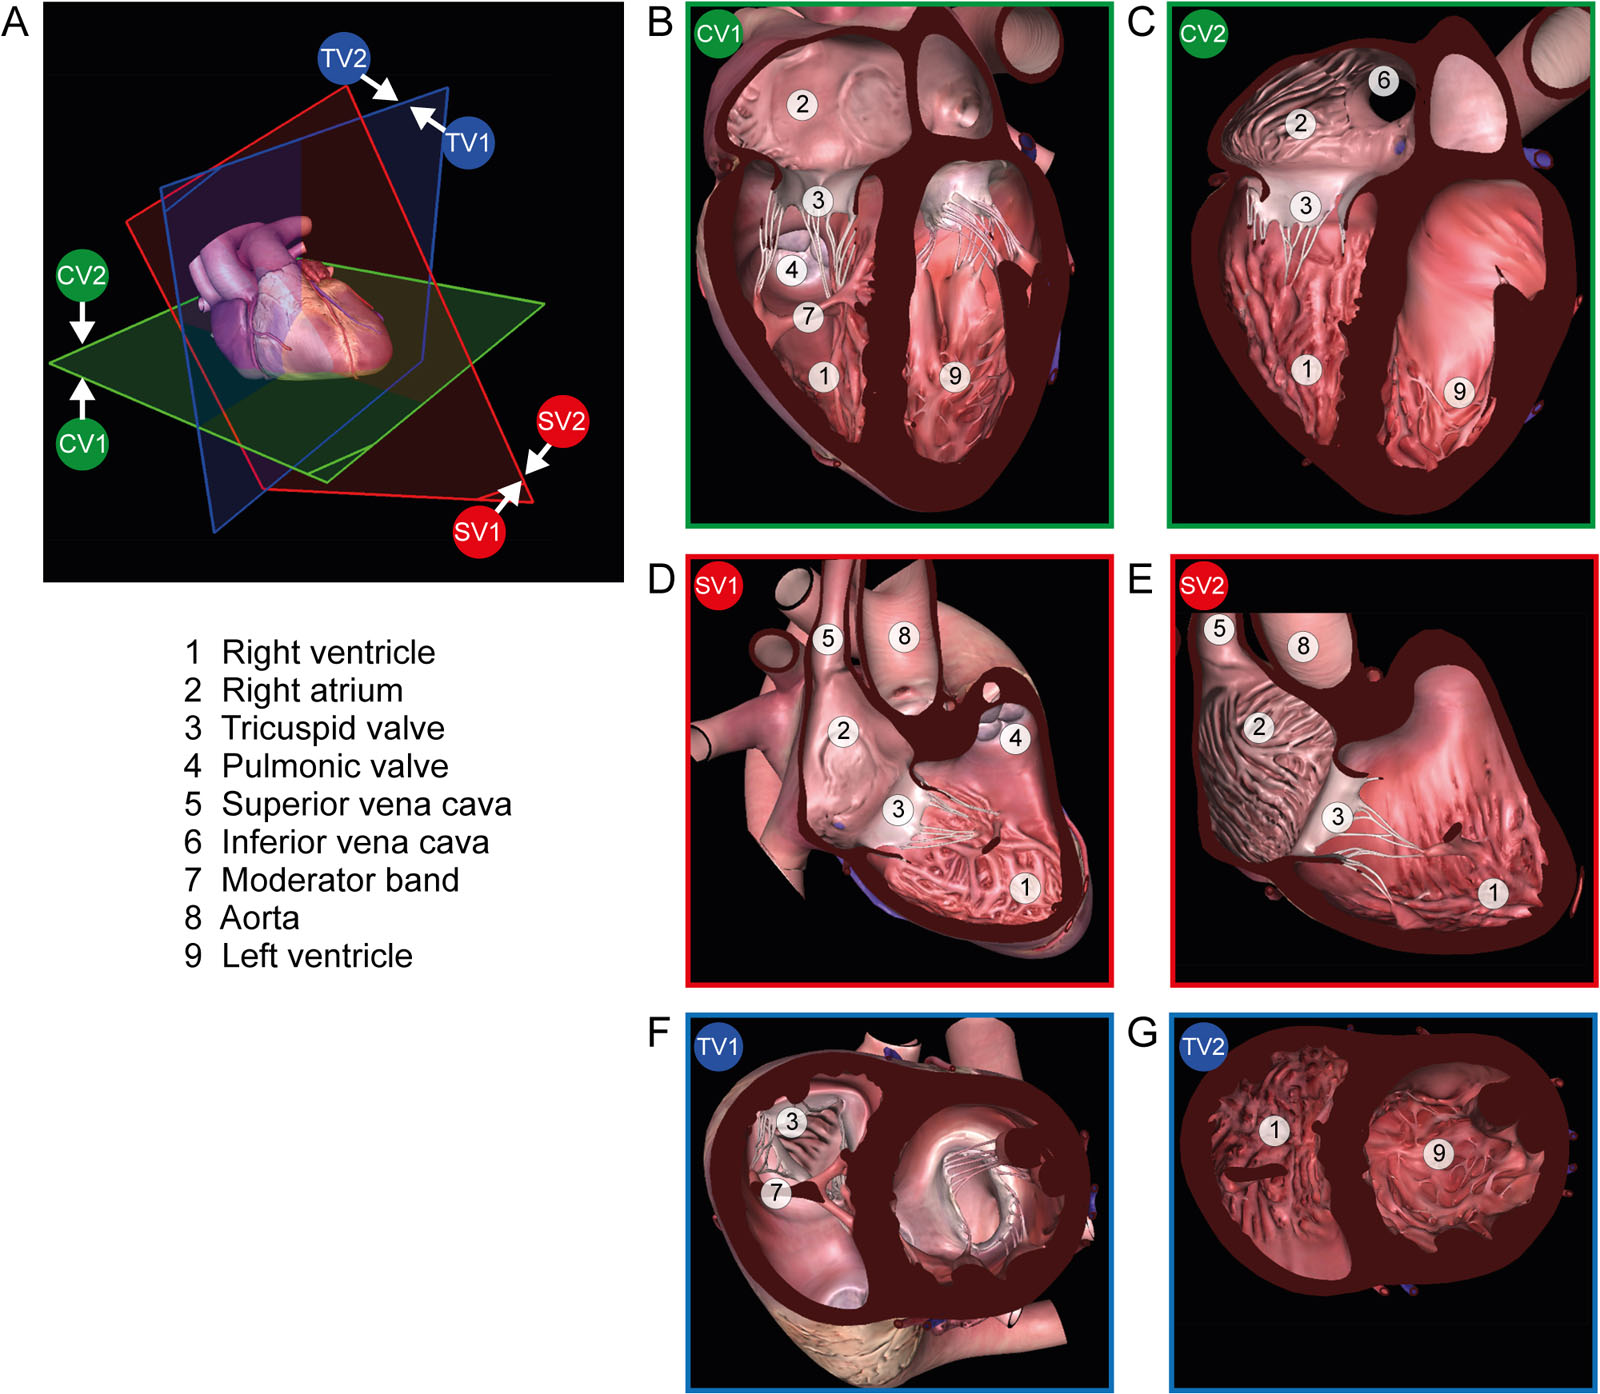
eFigure 10.21
2D, two-dimensional; 3D RV views. (A) 3D MPR planes with (B, C) coronal views (green CV1 and CV2), (D, E) sagittal views (red SV1 and SV2) and (F, G) transverse views (blue TV1 and TV2). The images planes are the same on 2D but on 3D a different perspective will be seen depending on which position (1 or 2) of the heart is displayed. Abbreviations: 3D, three-dimensional; MPR, multiplane reconstruction; RV, right ventricle.
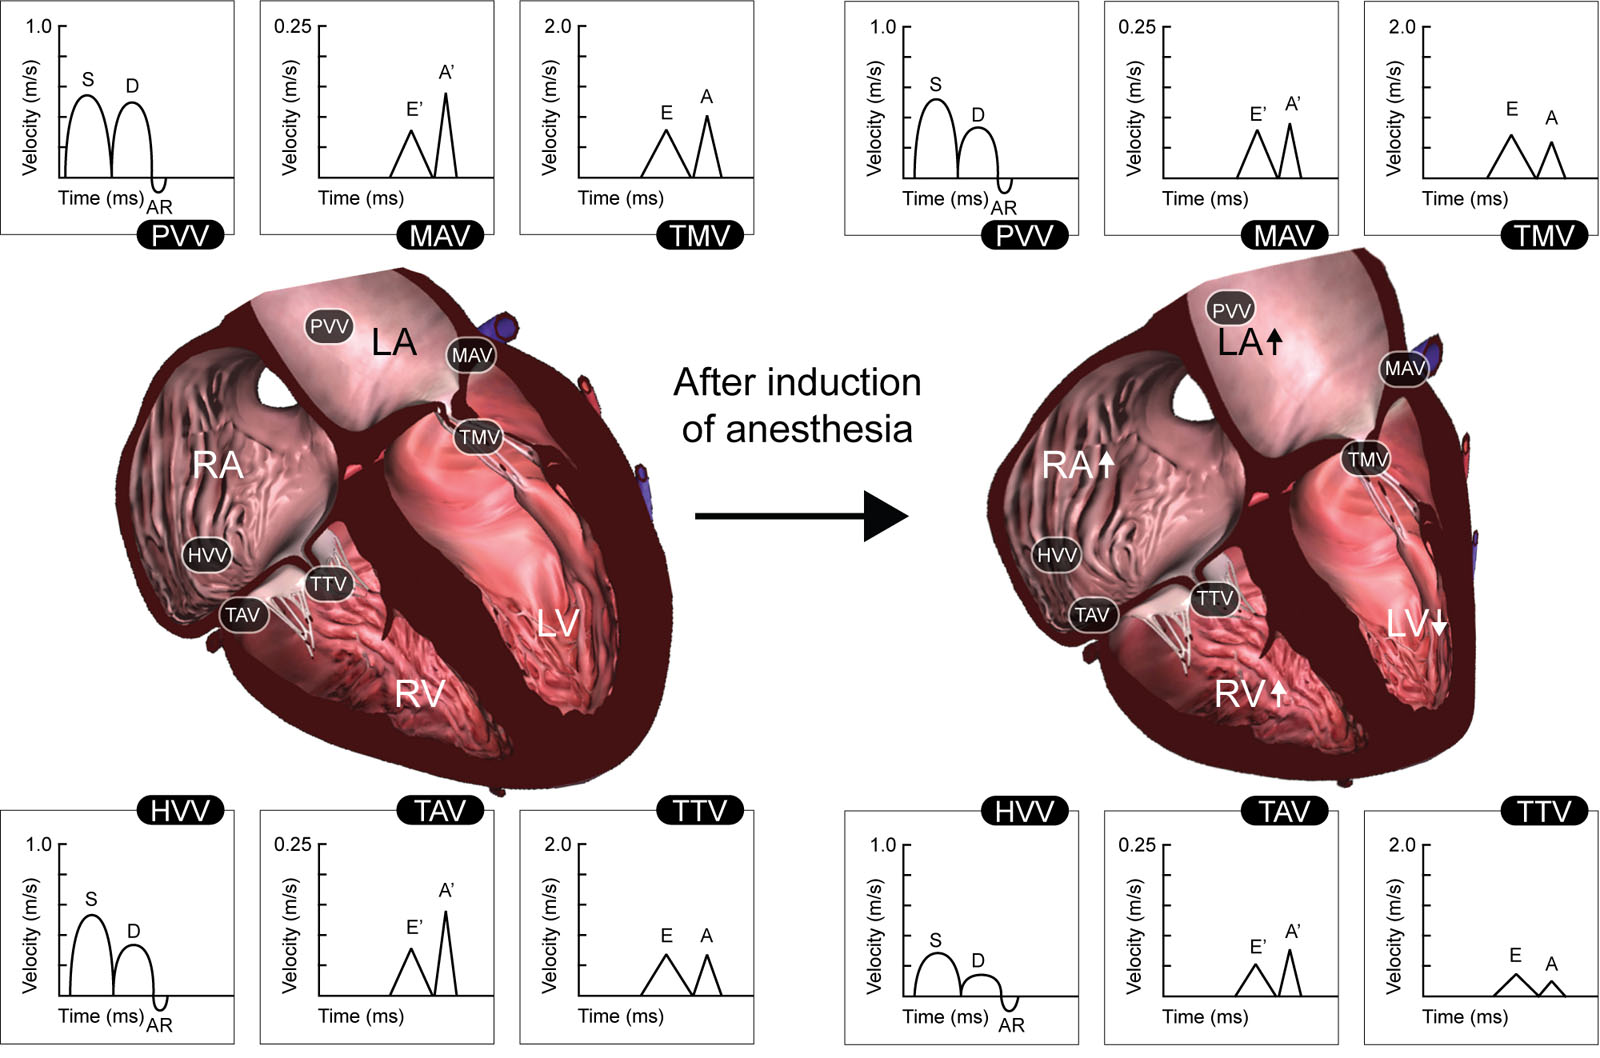
eFigure 10.38
Effect of anesthesia on cardiac function. This diagram summarizes the changes in cardiac dimensions and biventricular filling patterns after the induction of anesthesia. Presented are velocities for TMV and TTV peak early (E) and peak late (A) diastolic flow, HVV and PVV peak S, D, and AR flow, and MAV and TAV peak early (E;) and peak late (A′) diastolic flow. Abbreviations: AR, peak atrial reversal velocity; D, peak diastolic velocity; HVV, hepatic venous velocity; LA, left atrium; LV, left ventricle; MAV, mitral annulus velocity; PVV, pulmonary venous velocity; RA, right atrium; RV, right ventricle; S, peak systolic velocity; TAV, tricuspid annulus velocity; TMV, transmitral velocity; TTV, trans-tricuspid velocity. Adapted from Couture et al. 262
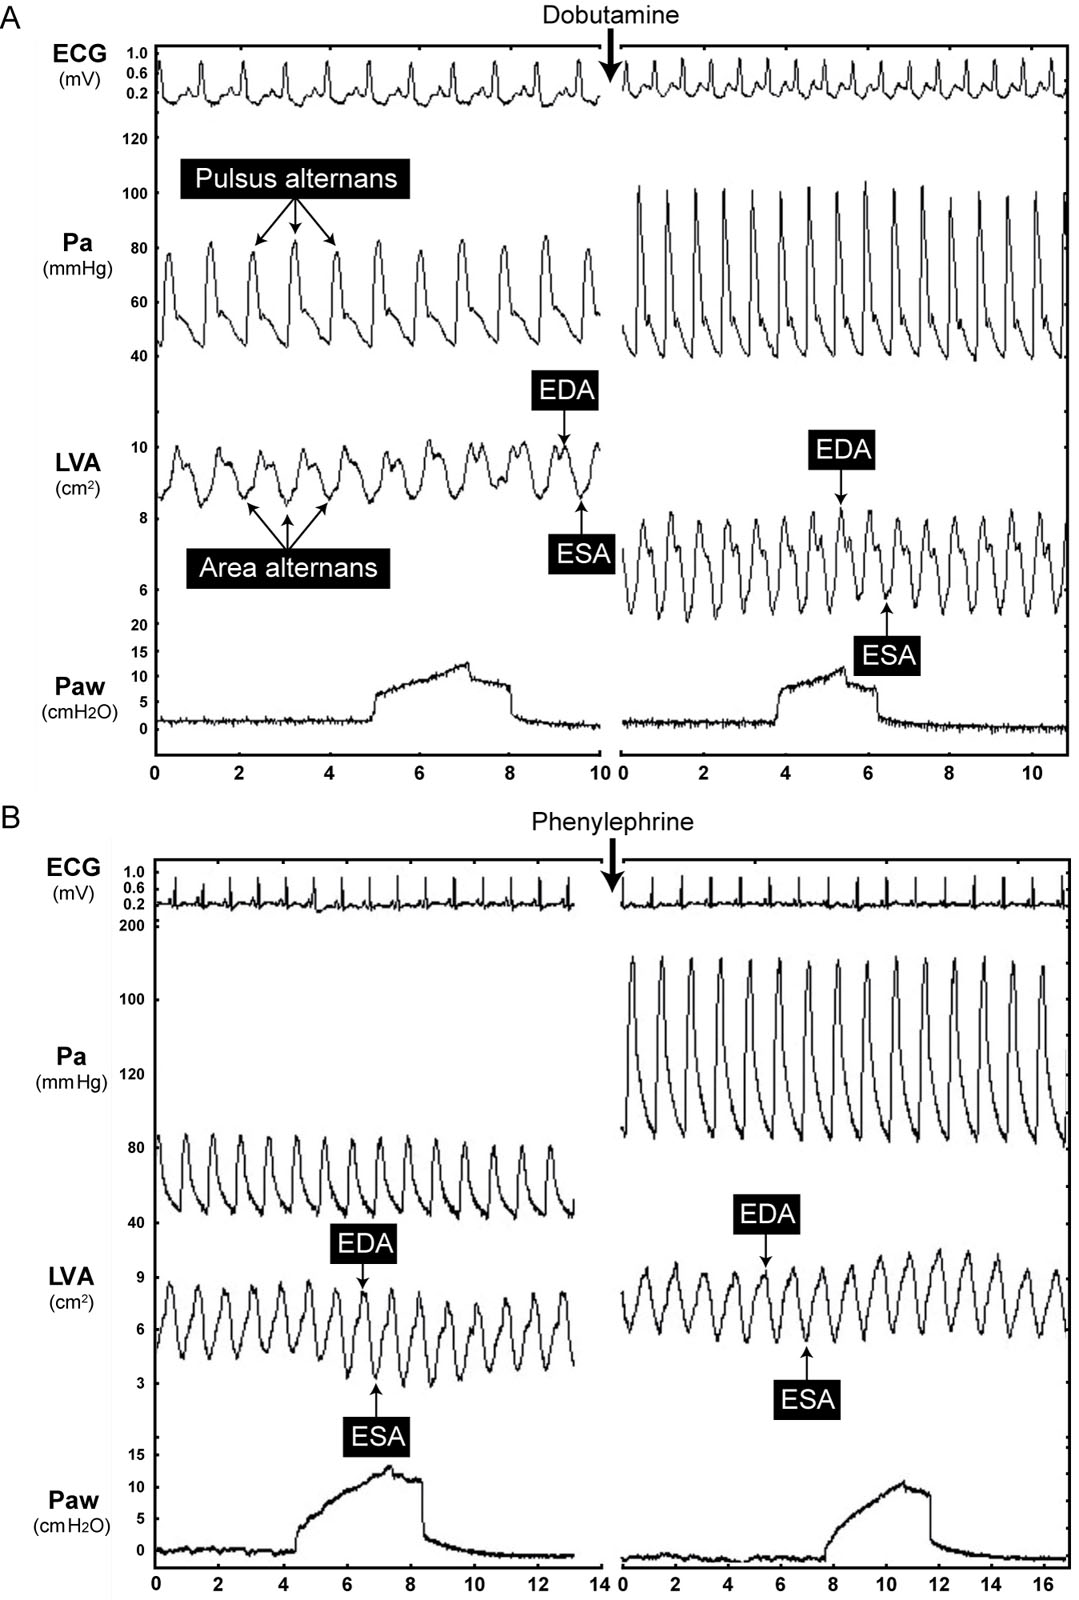
eFigure 10.39
Vasoactive agents. Diagrams showing the effectiveness of vasoactive agents on hemodynamic and echocardiographic parameters. (A) Dobutamine increases HR and Pa, decreases EDA and ESA with a significant increase in SA (SA = EDA–ESA) and in FAC (FAC = EDA–ESA/EDA). Pulsus alternans and area alternans disappear after administering dobutamine. (B) Phenylephrine administration did not change HR, increases Pa, EDA and ESA with no significant change in SA (SA = EDA - ESA) and in FAC (FAC = (EDA–ESA)/EDA). Continuous LVA tracing displays occurred by automated border detection using acoustic quantification. Abbreviations: ECG, electrocardiogram; EDA, end-diastolic area; ESA, end-systolic area; FAC, fractional area change; HR, heart rate; LVA, left ventricular area; Pa, arterial pressure; Paw, airway pressure; SA stroke area. Source: Courtesy of Dr. Michael R. Pinsky.
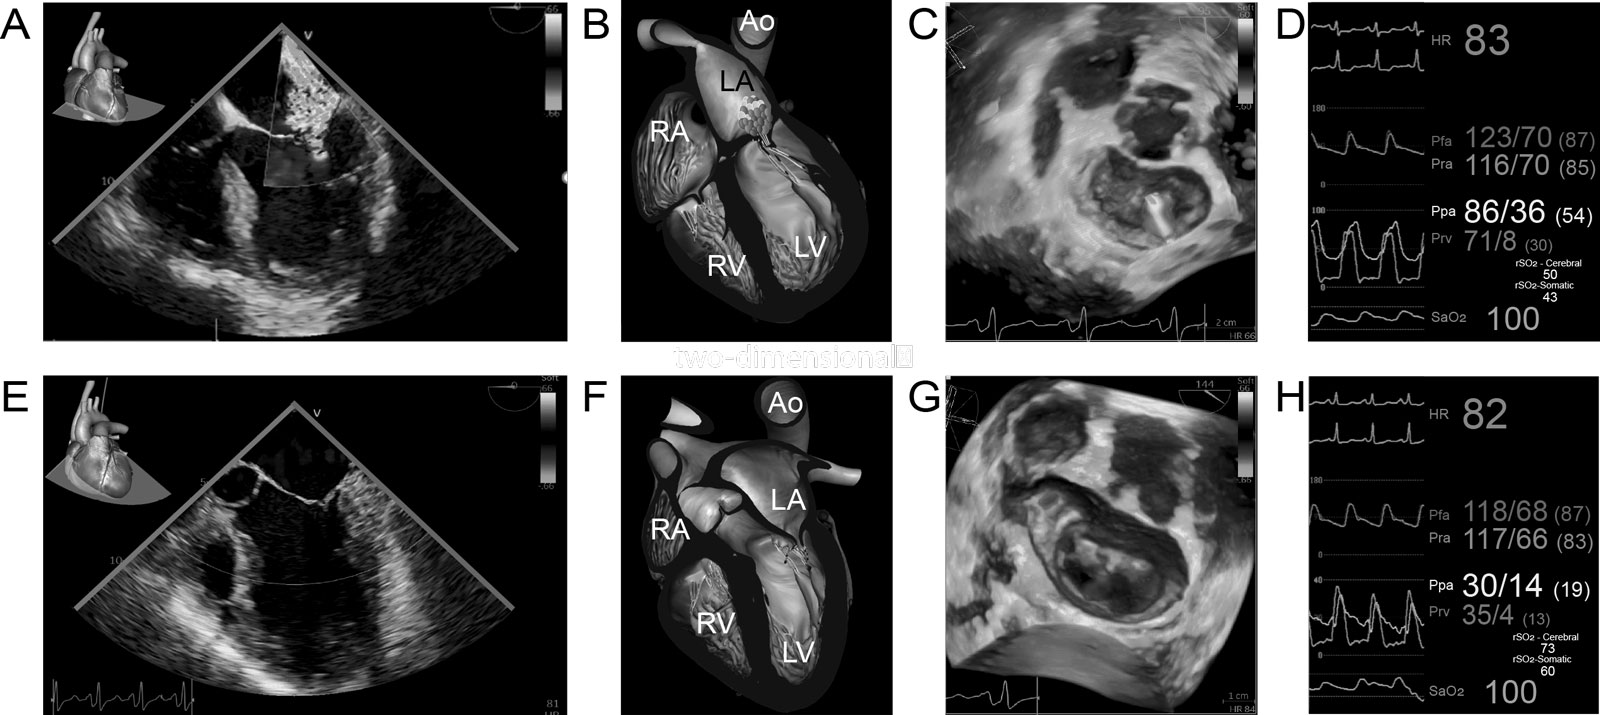
eFigure 10.40
Inhaled prostacyclin and milrinone cardiac effects. (A-C) ME 4C with CFI shows severe MR, confirmed by 3D en-face MV view, before inhaled epoprostenol and inhaled milrinone (iE&iM) administration. (D) There is elevation of Ppa (86/36 mmHg) and the regional brain oxygen saturation (rSO2) is left 50% and right 43%. (E-G) 30 minutes after iE&iM (60 ug and 4 mg), there is a significant reduction in MR, (E, F) in the ME 4C with CFI and (G) the 3D en-face MV views. (H) Hemodynamic waveforms 18 minutes after iE&iM administration show a significant reduction in the Ppa from 86/36mmHg to 30/4mmHg without significant changes in systemic arterial pressure (Pfa and Pra) and an increase in rSO2. Abbreviations: 3D, three-dimensional; 4C, four-chamber; Ao, aorta; CFI, color flow imaging; HR, heart rate; LA, left atrium; LV, left ventricle; ME, mid-esophageal; MR, mitral regurgitation; MV, mitral valve; Pfa, femoral arterial pressure; Ppa, pulmonary artery pressure; Pra, radial arterial pressure; Prv, right ventricular pressure; RA, right atrium; RV, right ventricle; SaO2, oxygen saturation. Adapted from Elmi Sarabi et al. 285
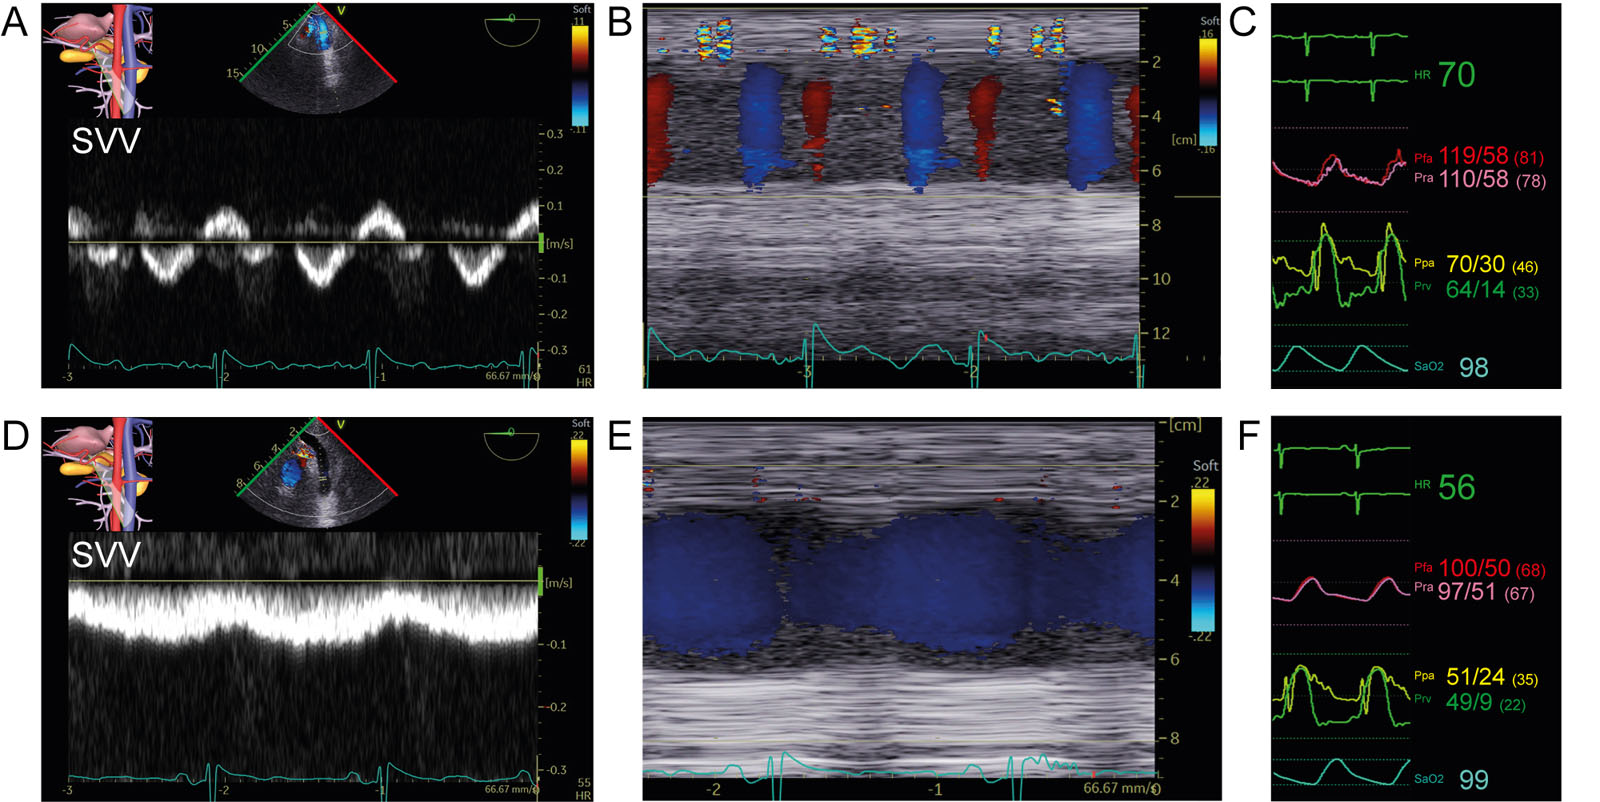
eFigure 10.42
Abnormal SVV and response to inhaled agents. (A, B) TGAUS view of the splenic vein with (A) PWD of splanchnic vein velocity and (B) CFI and M-mode imaging in a patient before revascularization, AoV replacement and aortic surgery. (C) The abnormal biphasic portal pulsatility in A was associated with severe PHT (Ppa 70/30mmHg). (D, E) Significant reduction in portal vein pulsatility appears after a (F) reduction in PHT (Ppa 51/24mmHg) and normalization of the diastolic Prv to 9mmHg following inhaled prostacyclin and milrinone. Abbreviations: AoV, aortic valve; CFI, color flow imaging; HR, heart rate; Pfa, femoral arterial pressure; PHT, pulmonary hypertension; Ppa, pulmonary artery pressure; Pra, radial arterial pressure; Prv, right ventricular pressure; PWD, pulsed-wave Doppler; SaO2, oxygen saturation; SVV, splenic vein velocity; TGAUS, transgastric abdominal ultrasound.
Videos
Chapter 10 Fig05A
Chapter 10 Fig05B
Chapter 10 Fig09AC
Chapter 10 Fig10
Chapter 10 Fig11AE
Chapter 10 Fig11C
Chapter 10 Fig11G
Chapter 10 Fig12A
Chapter 10 Fig13A
Chapter 10 Fig13C
Chapter 10 Fig13D
Chapter 10 Fig13F
Chapter 10 Fig17A
Chapter 10 Fig17B
Chapter 10 Fig18A
Chapter 10 Fig18B
Chapter 10 Fig18C
Chapter 10 Fig18D
Chapter 10 Fig22E
Chapter 10 Fig23ACDE
Chapter 10 Fig24C
Chapter 10 Fig26B
Chapter 10 Fig26D
Chapter 10 Fig26H
Chapter 10 Fig29A
Chapter 10 Fig29B
Chapter 10 Fig29D
Chapter 10 Fig29E
Chapter 10 Fig29F
Chapter 10 Fig30AD
Chapter 10 Fig30CF
Chapter 10 Fig30G
Chapter 10 Fig30H
Chapter 10 Fig30I
Chapter 10 Fig37A
Chapter 10 Fig37E
Chapter 10 Fig37GH
Chapter 10 Fig39
Chapter 10 Fig40A
Chapter 10 Fig40D
Chapter 10 Fig40E
Chapter 10 Fig40G
Chapter 10 Fig41A
Chapter 10 Fig41B
Chapter 10 Fig41E
Chapter 10 Fig41F
Chapter 10 Fig43A
Chapter 10 Fig43C
Chapter 10 Fig43E
Chapter 10 Fig43G
Tables
eTable 10.2 IVC stenosis imaging planes and findings
TEE view and modality |
Findings |
ME RV focused 4C view (2D, CFI) |
|
ME bicaval view (2D, CFI) |
|
ME modified bicaval view |
|
TGAUS LAX IVC and liver view (2D, PWD, CFI) |
|
Abbreviations: 2D, two-dimensional; 4C, four-chamber; CFI, color flow imaging; IVC, inferior vena cava; LAX, long-axis; ME, mid-esophageal; PWD, pulsed-wave Doppler; RA, right atrium; RV, right ventricular; TEE, transesophageal; TGAUS, transgastric abdominal ultrasound. Adapted from Sharma et al.10 |
|
eTable 10.3 Characteristics of Right and Left Ventricle
| Characteristics | Right ventricle | Left ventricle |
| Anatomic structure | Inflow region, trabeculated apex, infundibulum | No infundibulum, mitro-aortic continuity |
| Myocardial layers | 2 layers: superficial (circumferential contraction) & subendocardial (longitudinal contraction) | 3 layers: superficial, middle and subendocardial |
| Chamber walls | Anterior, lateral, inferior | Anterior, anteroseptal, inferoseptal, inferior, inferolateral, anterolateral |
| Coronary blood flow | Perfusion during systole and diastole Vulnerable to increase of intracavitary RV pressure Higher oxygen extraction reserve | Perfusion mainly in diastole Better pressure-flow autoregulation |
| Cellular structure | RV cardiomyocytes are 15% smaller that LV cardiomyocytes 30% more collagen in RV | |
| Shape | From the side: triangular Cross section: crescentic | Ellipsoidal |
| End-diastolic volume (mL/m2) | Women: 53.6 ± 10.5, (32-74) Men: 61 ± 13, (35-87) 10-15% larger than LV | Women: 45 ± 8, (29-61) Men: 54 ± 10, (34-74) |
| Mass a (g/m2) | <35, ≈ 1/3 to 1/6 of LV mass | Women: £95, Men: £115 |
| Wall thickness a (mm) | Lateral wall: 3 ± 1, (1-5) | Women: 6-9, Men: 6-10 |
| Ejection fraction a (%) | 3D: 58 ± 6.5, abnormal if < 45% | 2D: Women: 54-74, Men: 52-72 |
| Ventricular pressure (systole/diastole, mmHg) | (15-30) / (1-7) | (90-140) / (5-12) |
| Ventricular elastance (Emax) (mmHg/mL) | 1.30 ± 0.84 | 5.48 ± 1.23 |
| PVR, SVR (dynes×s×cm-5) | PVR: 70 (20-130) | SVR: 1100 (700-1600) |
| Stroke work index (g/m2 per beat) | 8 ± 2 (1/6 of LV stroke work) | 50 ± 20 |
| Ventricular compliance | Higher compliance than LV | 5.0 ± 0.52 × 10⁻² |
| Filling profile | Starts earlier and finishes later, lower filling velocities | Starts later and finishes earlier, higher filling velocity |
| Contraction profile | Peristalsis-like motion | Radial shortening, contraction longitudinal & rotational |
| Resistance to ischemia | Greater resistance to ischemia | More susceptible to ischemia |
| Adaptation to disease | Better to volume overload | Better to pressure overload |
| a Range of normal values depends on the method of acquisition and are mean ± standard deviation or normal range. Abbreviations: 2D, two-dimensional; 3D, three-dimensional; LV, left ventricular; PVR, pulmonary vascular resistance; RV, right ventricular; SVR, systemic vascular resistance. Adapted from37, 305 304 | ||
Table 10.6 TEE RV views
| TEE View | Icon | View-Technique | Utility for right heart structures | |
| Mid-esophageal | ||||
| 1 |  |  | ME RV focused 4C Angle: 0-10° (Figure 10.24) | Chambers: RA, RV Valve: TV Septum: IVS, IAS |
| 2 |  | 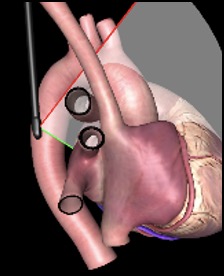 | ME Ascending aorta LAX Angle: 120-140° (See Figure 4.14) | Vessel: RPA |
| 3 | 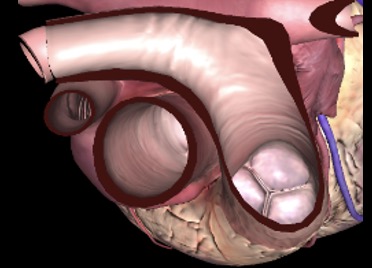 | ME Ascending Aorta SAX Angle: 0-30° (Figure 10.10) | Vessels: PA, RPA, SVC | |
| 4 | 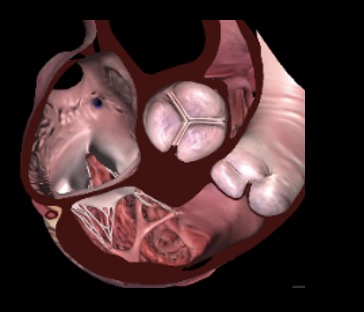 | ME AoV SAX Angle: 25-45° (See Figure 4.28) | Chambers: LA, RA, RV, RVOT Valves: PV, TV Septum: IVS, IAS Vessels: PA, RCA | |
| 5 | 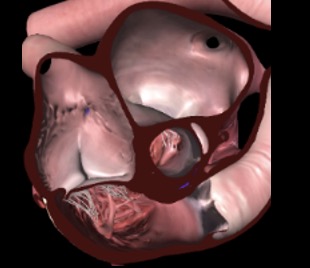 |  | ME RV Inflow-Outflow Angle: 50-70° (Figure 10.30) | Chambers:RA, RV, RVOT Valves: TV, PV Septum: IVS, IAS Vessels: PA |
| 6 | ME Modified Bicaval TV Angle: 90-120° (See Figure 4.30) | Chambers: RA, RV Valves: TV Septum: IAS Vessels: IVC, SVC Other: RA appendage | ||
| 7 |  |  | ME Bicaval Angle: 90-110° (See Figure 4.29) | Chambers: LA, RA Valves: TV Septum: IAS Vessels: IVC, SVC, Ao Other: RA appendage |
| Deep-esophageal | ||||
| 8 |  |  | DE 2C RV Angle: 0-10° (See Figure 4.9) | Chambers: RA, RV Valve: TV Septum: IVS Other: coronary sinus |
| 9 |  | DE RV inflow-outflow Angle: 60-90° (See Figure 4.31) | Chambers: RA, RV, RVOT Valves: TV Septum: IAS | |
| Transgastric | ||||
| 10 | TG Basal SAX Angle: 0-20 (See Figure 4.17) | Chambers: LV, RV Valves: MV, TV Septum: IVS | ||
| 11 | TG Mid papillary SAX Angle: 0-20° (Figure 10.20) | Chambers: LV, RV Septum: IVS Other: papillary muscles | ||
| 12 | TG RV basal SAX Angle: 0-20° (See Figure 4.21) | Chambers: LV, RV, RVOT Valves: TV, PV Septum: IVS | ||
| 13 | TG RV Inflow outflow Angle: 0-20° (Figure 10.22) | Chambers: RA, RV, RVOT Valves: TV, PV Septum: IVS, IAS Vessels: PA, Asc Ao | ||
| 14 | Deep TG 5C Angle: 0-20° (See Figure 4.24) | Chambers: LA, LV, LVOT, RA, RV , RVOT Valves: AoV, MV, TV Septum: IVS, IAS Vessels: Aortic root | ||
| 15 | TG RV inflow Angle: 90-110° (See Figure 4.23) | Chambers: RA, RV, RVOT Valves: TV Vessels: Ao, PA | ||
| 16 | UE Aortic arch SAX Angle: 70-90° (See Figure 4.27) | Valve: PV Vessels: Aortic arch, PA, innominate and hemiazygos vein Other: mediastinal tissue | ||
| Extra-cardiac | ||||
| 17 |  |  | Hepatic vein Angle: 0±20° (See Figure 32.31C) | Vessels: Hepatic veins, IVC |
| 18 | Portal vein Angle: 70±20° (See Figure 32.33) | Vessels: Portal vein and hepatic artery | ||
| 19 |  |  | Splenic vein Angle: 0-20° (See Figure 32.45) | Vessels: Splenic vein and artery |
| Alternative views 306 | ||||
| 1 |  | ME Coronary sinus SAX Angle: 90±10° | Other: Coronary sinus | |
| 2 | ME PV SAX Angle: 165±20° | Valve: PV | ||
| 3 | ME PA LAX Angle: 100±10° | Chamber: RVOT Valve: PV Vessel: MPA | ||
| 4 |  | DE Coronary sinus Angle: 30±10° | Other: Coronary sinus | |
| 5 |  |  | DE TV 2C LAX Angle: 90±20° | Chambers: RA, RV Valves: TV Septum: IAS Vessels: IVC, SVC Other: coronary sinus |
| 6 |  | DE Coronary sinus LAX Angle: 120±20° | Chambers: RA, RV Valves: TV Septum: IAS Vessels: IVC, SVC Other: coronary sinus | |
 | TG RV Outflow Angle: 60±20° | Chambers: RV Valves: PV Septum: IVS Vessels: MPA | ||
| 7 | 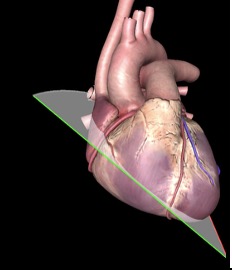 | DTG 4C Angle: 0±20° | Chambers: RA, RV Valves: TV Septum: IVS, IAS | |
| 8 | 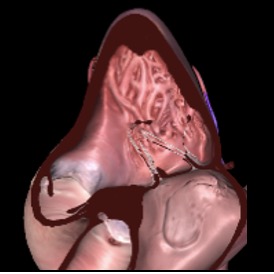 | 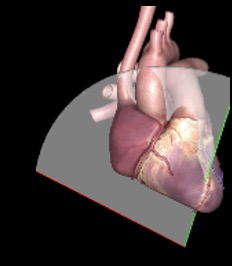 | DTG RV inflow-outflow Angle: 120±20° | Chambers: RA, RV, RVOT Valves: TV, PV Septum: IVS Vessels: PA, Asc Ao |
| Abbreviations: 2C, two-chamber; 4C, four-chamber; Ao, aorta; Asc, ascending; DE, deep esophageal; DTG, deep transgastric; IAS, interatrial septal;IVC, inferior vena cava; IVS, interventricular septum; LA, left atrium; LAX, long-axis; | ||||
eTable 10.9 Evaluation of diastolic function
| Parameters | Normal values | Role | Limitation |
| Hemodynamic | |||
| LVEDP | < 15 310 | The LV pressure wave is a reflection of ventricular compliance and therefore indirectly represents the clinical conditions that affect ventricular performance | Only available through left heart catheterization |
| PCWP or LAP (mmHg) | 2-12 19 | LAP increases as a consequence of LV diastolic dysfunction. | Only available from pulmonary artery catheterization Estimates the LVEDP if there is no flow obstruction between LA and LV and if the LV compliance is normal. |
| LV dP/dtmin (mmHg/sec) | -2000 311 | Corresponds to the peak instantaneous rate of LV pressure decline. LV dP/dtmin can be estimated from the following formulas: LV dP dP/dtmin = (4VAR ´ 1000/20), where VAR is aortic regurgitation velocity in m/s at 20 ms after the onset of regurgitation. LV dP dP/dtmin = [4(VMR2)2 - (VMR1)2 ´ 1,000/20], where VMR is mitral regurgitation velocity in m/s, 20 ms apart. | - Not clinically practical as it needs high-fidelity LV pressure catheters to measure - Requires a high-quality AR or MR signals with complete jet. |
| Tau (t) (msec) | 30-40 | Corresponds to the time it takes for LV pressure, measured at the peak rate of LV pressure decay after aortic valve closure, to decrease by approximately one third. LV relaxation is nearly complete by 3.5 t, during the RFP. 186 Tau can be estimated from the following formulas: 1. Tau = IVRT / (Ln LVESP - Ln LA pressure) where LA pressure is estimated to be 10 mmHg.312, 189 2. Tau is the time interval between the onset of AR and the regurgitant velocity corresponding to (1-1/e)1/2 of maximal AR velocity. 3. Tau is the time interval between dP/dtmin to the point at which the MR velocity is (1/e)1/2 of MR velocity at the time of dP/dtmin. | Non-invasive Tau estimation requires arbitrary estimation of LAP and systolic blood pressure can be different from LVESP. The use of multiple measurements and estimations can lead to inaccurate values. |
| 2D echocardiography | |||
| Maximal LA volume index (mL/m2) | £ 34 | Reflects the cumulative effects of increased LV filling pressures over time. Provides diagnostic and prognostic information about LV diastolic dysfunction and chronicity of disease. Increased LA volume is an independent predictor of death, heart failure, atrial fibrillation, and ischemic stroke. | LA dilation can be seen despite normal LV diastolic function in the following circumstances: bradycardia, high-output states, heart transplants with biatrial technique, atrial flutter/fibrillation er significant mitral valve disease. LA dilatation occurs in well-trained athletes who have bradycardia and are well hydrated. May be difficult to measure in patients with ascending & descending aortic aneurysms and large interatrial septal aneurysms. |
| Mitral E-wave velocity (cm/s) | < 50 313 £ 50 189 50-80 311 | E-wave velocity reflects the LA to LV pressure gradient during early diastole or RFP. Affected by alterations in the rate of LV relaxation and LA pressure. In patients with dilated cardiomyopathy and reduced LVEF, mitral velocities correlate better with LV filling pressures, functional class, and prognosis than LVEF. | In patients with CAD and patients with HCM in whom LVEF is >50%, mitral velocities correlate poorly with LV filling pressures. Difficult to interpret in patients with arrhythmias. Directly affected by alterations in LV volumes and elastic recoil. Age dependent; decreasing with age |
| Mitral A-wave velocity (cm/s) | 30-50 | A-wave velocity reflects the LA to LV pressure gradient during late diastole or atrial systole. Affected by LV compliance and LA contractile function. | Sinus tachycardia, first-degree AV block and paced rhythm can result in fusion of the E and A waves. If mitral flow velocity at the start of atrial contraction is >20 cm/sec, A velocity may be increased. Not applicable in AF/atrial flutter patients Age dependent (increases with aging) |
| Mitral A-wave duration | Time interval from A-wave onset to end of A wave at zero baseline. If E and A are fused (E velocity > 20 cm/sec when A velocity starts), A-wave duration will often be longer because of increased atrial filling stroke volume. If the PR interval is too short, atrial filling is terminated early by ventricular contraction thus reducing mitral A duration, LVEDV and cardiac output. | Not applicable in AF/atrial flutter patients | |
| Mitral L-wave (cm/s) | <20 | Represent abnormal mid-diastolic flow caused by prolonged LV relaxation. L waves are best appreciated at lower heart rates and LAP when there is adequate separation of E and A waves or when A waves are absent, as in AF. Specific for elevated LV filling pressures in patient with known cardiac disease L wave <20 cm/sec are not clinically significant. | Rarely seen in normal LV diastolic function when the subject has bradycardia, but it is then usually <20 cm/sec. Overall low sensitivity |
| Mitral E-wave deceleration time (msec) | 160 to 200 | Corresponds to the time required for the peak E-wave velocity to cross the baseline. Influenced by the rate of decline in LA to LV pressure gradient after mitral valve opening, and therefore LV stiffness. When LV relaxation is slow, LV relaxation also affects DT. | DT does not relate to LVEDP in normal LVEF. Should not be measured with E and A fusion due to potential inaccuracy. Age dependent (increases with age) Not applied in atrial flutter |
| IVRT (msec) | £ 70 189 | IVRT increases as tau is prolonged. Measured from the time offset between aortic valve closure, at the end of the outflow tract waveform, and mitral valve opening, at the beginning of the mitral E wave. IVRT depends on LV relaxation, LA “v” pressure, LVESP and heart rate. When LAP , IVRT shortens, and its duration is inversely related to LV filling pressures in patients with cardiac disease. IVRT <70 ms is usually associated with LAP in patients with impaired LV relaxation. IVRT prolongation (>110 msec) is seen in patients with grade 1 filling and is the earliest Doppler manifestation of impaired LV relaxation. | More challenging to interpret in the setting of tachycardia, has many hemodynamic determinants that lead to opposing changes in IVRT including heart rate, LVESP, left atrial pressure, and LV relaxation. Results differ whether using CWD or PWD for acquisition. |
| PV S velocity (cm/sec) | 28–82 311 | Influenced by changes in LAP, LA, LV and RV contractility. S velocity associated with PV stenosis, LV contractility ¯ S velocity associated with ¯ LA compliance, LAP, MR, AF ¯ S velocity, S/D ratio < 1, and systolic filling fraction (VTIs/[VTIs+VTID]) < 40% indicate LAP in patients with reduced LVEF. | The relationship between PV systolic filling fraction and LAP has limited accuracy in patients with normal LVEF, AF, mitral valve disease and HCM. Difficult to interpret in patients with sinus tachycardia or first-degree AV block with E and A fusion. PV flows may be difficult to interpret in the presence of PV anastomosis. |
| PV D velocity (cm/s) | 27-72 311 | Influenced by early diastolic LV filling and compliance and it changes in parallel with mitral E velocity. D velocity associated with LAP ¯ D velocity associated with ¯ preload and impaired LV relaxation | |
| PV D velocity DT (msec) | >275 311 | Can be used to estimate mean PCWP in patient with AF; ¯ D velocity DT associated with LAP. | |
| PV S/D ratio | > 1 | ||
| PV A velocity (cm/s) | 15-35 311 | Influenced by LA contractility and LV stiffness A velocity associated with LVEDP, ¯ P-R interval and mitral stenosis ¯ A velocity associated with ¯ preload, ¯ LA mechanical function, AF, tachycardia, P-R interval. | |
| PV Ar-wave duration (msec) | 60-120 311 | Corresponds to the time interval from Ar-wave onset to its return to zero baseline. When LV compliance is reduced, PV Ar-wave duration becomes prolonged and mitral A duration shortens. Once the difference between PV Ar-wave duration and mitral A duration (Ar -A duration) exceeds 30 msec, the reduction in LV compliance becomes sufficient to LVEDP. | |
| PV Ar-A duration (msec) | < 20 311 | The duration of transmitral flow into the lower impedance LV exceeds the duration of flow into the PV if ventricular compliance is normal. The time difference between duration of PV flow and mitral inflow during atrial contraction is associated with LV pressure because of atrial contraction and LVEDP. time difference is associated with LVEDP PV Ar-wave duration > mitral A-wave duration by 30 msec indicates an increased LVEDP, independent of age and LVEF. Accurate in patients with MR and patients with HCM. | |
| TDI derived | |||
| a’ (cm/s) | 11.3 ± 2.9 311 | a’ represents the late mitral annular ascent (atrial systole) following diastasis. a’ velocity is a reliable index of atrial contractility 314 The VTI of a’ corresponds to the amount of LA major-axis shortening during atrial systole. a’ corresponds to the compensatory in atrial contractility when early diastolic filling is ¯. ¯ a’ corresponds to the progressive ¯ of atrial contractility that occurs in ¯ LV compliance ( LVEDP). | |
| e’ (cm/s) | septal : >7 lateral: >10 | The hemodynamic determinants of e’ velocity are LV relaxation, restoring forces and filling pressure. In myocardial disease, LV filling pressure has limited effects on e’. It is recommended to measure at septal and lateral annulus and to consider average e’. Reversed relationship between lateral in septal in constrictive pericarditis (annulus paradoxus) 315 | Age dependent Cutoff for normal values depends on sampling site; lower accuracy in segmental dysfunction, particularly involving basal LV segments, pericardial constriction, heavy mitral annular calcification, prosthetic mitral valve, surgical annuloplasty, and mitral valve disease. |
| L’ | Normally not seen | Markedly delayed LV relaxation in the setting of LV filling pressures allows for ongoing LV filling in mid diastole and thus L velocity. Usually seen in patient with bradycardia. L wave, seen in about half of patients with transmitral L waves, suggests the presence of LAP. | |
| CWD derived | |||
| PR end-diastolic velocity (m/sec) | Variable according to RA pressure | A significant correlation exists between diastolic PA pressure and invasively as well as noninvasively derived LAP. In the absence of pulmonary disease, diastolic PA pressure is consistent with LA pressure. Diastolic PA pressure can be used as a surrogate of LAP. | Adequate recording of a full PR jet envelope is not always possible. Accuracy of calculation is dependent on the reliable estimation of mean RA pressure. If mean PA pressure is >40 mm Hg or pulmonary vascular resistance >200 dynes/s/cm-5, PA diastolic pressure is higher by >5 mmHg over mean PCWP. No relation to LAP in WHO group I pulmonary hypertension. |
| TR maximal velocity (m/sec) | < 2.8 | A significant correlation exists between systolic PA pressure and noninvasively derived LAP. In the absence of pulmonary disease, systolic PA pressure suggests LAP. Systolic PA pressure can be used as an adjunctive parameter of LAP. Evidence of pulmonary hypertension has prognostic implications. | Indirect estimate of LAP Accuracy heavily depends on correct estimation of RA pressure |
| Color M-mode | |||
| Vp: Vp, and E/Vp ratio | Vp > 50 cm/sec E/Vp < 2.5 | Vp correlates with time constant (tau) of LV relaxation. As Vp corrects for the effect of LV relaxation on E, E/Vp ratio relates directly to LAP. Vp is reliable as an index of LV relaxation in patients with depressed LVEF and dilated LV but not in patients with normal LVEF. E/Vp ³ 2.5 predicts PCWP >15 mmHg with reasonable accuracy in patients with depressed LVEF. | There are different methods for measuring mitral-to-apical flow propagation. In patients with normal LV volumes and LVEF but LV filling pressures, Vp can be misleadingly normal. Lower feasibility and reproducibility. Angulation between M-mode cursor and flow results in erroneous measurements |
| Strain derived | |||
| LA GLS | 35±6% 316 | Reflects LA reservoir function Inversely correlated to LAP Can be used as an index of LA stiffness | Limited data on its accuracy in the presence of atrial arrhythmias, mitral valve disease, and mitral annular calcification. Dependent on LV systolic function |
| LA reservoir strain (Sr) | 39%317 | Calculated as difference between onset of filling and end-diastole (positive value) Dependent of LA relaxation, LV systolic function and LA chamber stiffness. | |
| LA conduit strain (Scd) | 23%317 | Calculated as difference between onset of atrial contraction and onset of filling (negative value) Directly related to early diastolic mitral annulus velocity (e’). Dependent on both LV relaxation and LV interstitial fibrosis which affects LV chamber stiffness | |
| LA contraction strain (Sct) | 17%317 | Calculated as difference between end-diastole and onset of atrial filling (negative value) In general, impaired LV relaxation in the presence of normal LAP is associated with decreased LA conduit strain and increased LA contraction strain. Dependent on LA systolic properties and LA afterload as reflected by LV late diastolic pressures. | |
| LV GLS (%) LV diastolic SRIVR (s–1) LV diastolic SRE (s–1) | Diastolic SRIVR relates to LV relaxation. Since SRIVR corrects for the effect of LV relaxation on E, E/SRIVR relates directly to LAP. Diastolic SRE relates to LV relaxation and LV filling pressures. As SRE corrects for the effect of LV relaxation on E, E/ SRE relates directly to LAP. | ||
| Calculated variables | |||
| Mitral E/A ratio | >0.8 to <2.0 | E velocity is dependent on LA to LV pressure gradient in early diastole and therefore LV relaxation and LA “v” pressure. A-wave velocity depends on LA to LV pressure gradient during late diastole, and therefore LV stiffness and LA contractility. ratio usually predicts LV filling pressure in patients with myocardial disease but is not useful in normal subjects. In patients with dilated cardiomyopathy, filling patterns correlate better with filling pressures, functional class, and prognosis than LVEF. A restrictive filling pattern in combination with LA dilation in patients with normal LVEF is associated with a poor prognosis similar to a restrictive pattern in dilated cardiomyopathy. | Age dependent (decreases with aging) Affected by arrhythmias, LV volumes and elastic recoil Weak relation with LV filling pressure in patients with HCM and coronary artery disease with LVEF >50% The U-shaped relation with LV diastolic function makes it difficult to differentiate normal from pseudonormal filling, particularly with normal LVEF, without additional variables. If mitral flow velocity at the start of atrial contraction is >20 cm/sec, E/A ratio will be reduced due to fusion. |
| E/e’ ratio | <14 <8 is associated with normal LV filling pressure. >14 is associated with LV filling pressure. | E/e’ ratio correlates to LAP. The numerator (E) is a surrogate for the LA to LV pressure gradient The denominator (e’), may be regarded as the extent to which the LA to LV gradient is generated by ventricular suction. e’ is dependent on LV relaxation. As e’ corrects for the effect of LV relaxation on E, E/e’ ratio relates directly to LAP. In patients with E/e’ of 9 to 14, LAP cannot be determined. | Age dependent Cutoff value for normal values depends on sampling site Does not relate with LV filling pressure in normal subjects or patients with pericardial constriction Not reliable in patients with heavy mitral annular calcification, prosthetic mitral valve, surgical annuloplasty, mitral stenosis, and primary mitral regurgitation Lower accuracy in patients with left bundle branch block, pacemakers |
| TE-e’ time interval | Can identify patients with diastolic dysfunction due to delayed onset of e’ velocity compared with onset of mitral E velocity. 1. Ratio of IVRT to TE-e’ can be used to estimate LV filling pressures in normal subjects and patients with mitral valve disease. 2. TE-e’ can be used to differentiate patients with restrictive cardiomyopathy who have a prolonged time interval from those with pericardial constriction in whom it is not usually prolonged. | More challenging to acquire satisfactory signals with close attention needed to location, gain, filter settings as well as matching RR intervals. | |
Abbreviations: 2D; two-dimensional; a’: peak atrial systolic mitral annular velocity using TDI; e’: early diastolic velocity of mitral annulus using TDI;A: atrial; AF: atrial fibrillation; Ar: atrial reversal; AR: aortic regurgitation; AV: atrioventricular; CAD: coronary artery disease; CWD: continuous-wave Doppler; D: diastolic; DT: deceleration time; GLS: global longitudinal strain; HCM: hypertrophic cardiomyopathy; IVR: isovolumic relaxation; IVRT: isovolumic relaxation time; L: mid-diastolic flow velocity; L’: mid-diastolic flow velocity of mitral annulus using TDI; LA: left atrial / atrium; LAP: left atrial pressure; LV: left ventricular / ventricle; LVEDP: left ventricular end-diastolic pressure; LVEDV: left ventricular end-diastolic volume; LVEF: left ventricular ejection fraction; LVESP: left ventricular end-systolic pressure; MR: mitral regurgitation; MV: mitral valve; PA: pulmonary artery; PCWP: pulmonary capillary wedge pressure; PR: pulmonary regurgitation; PV: pulmonary vein; PWD: pulsed-wave Doppler; RA: right atrial; RFP: rapid filling period; RV: right ventricle/ventricular; S: systolic; Scd: conduit strain; Sct: contraction strain; Sr: reservoir strain; SR : strain rate; SRE: strain rate during early diastole; SRIVR: strain rate during isovolumic relaxation time; t: tau; TDI: tissue Doppler imaging; TE-e’: time delay between onset of E and e’; TR: tricuspid regurgitation; V: velocity; Vp: propagation velocity; VTI: velocity time integral; WHO: World Health Organization