Figures
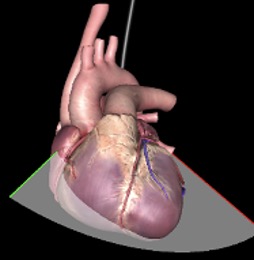
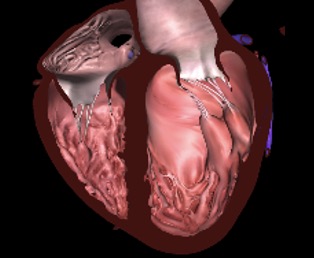
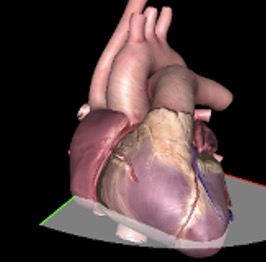
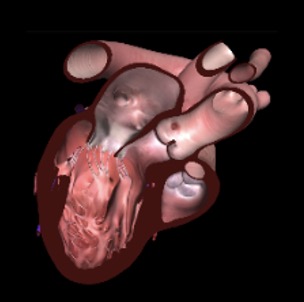
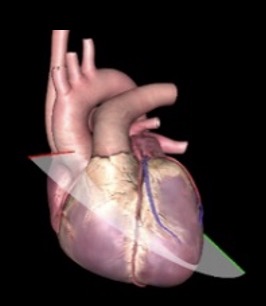
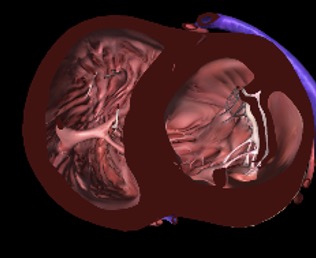
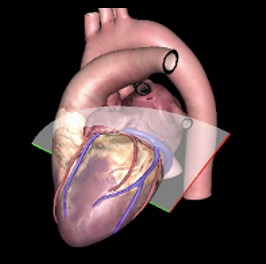
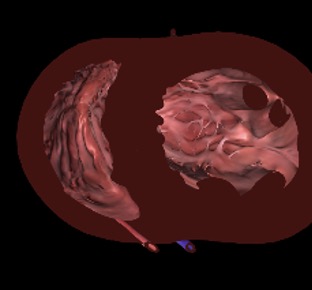
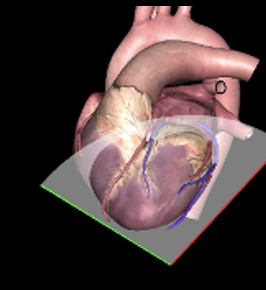
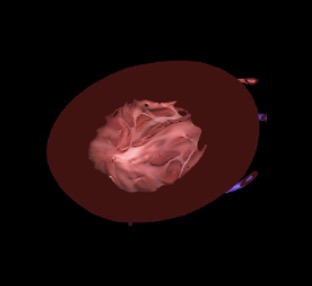
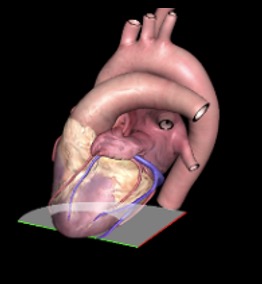
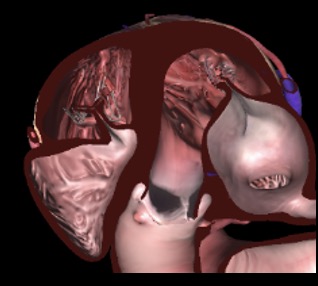
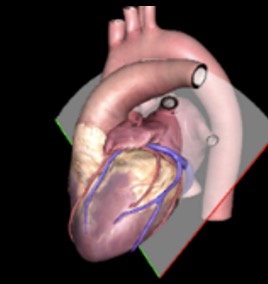
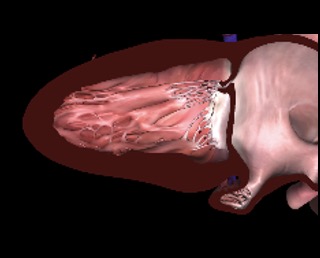
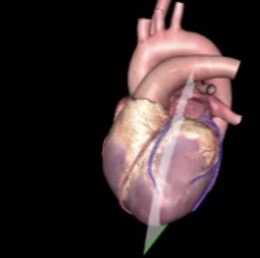
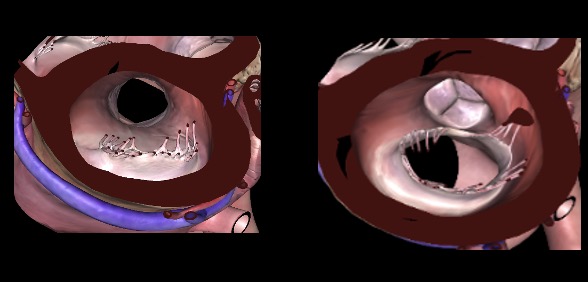
eFigure 11.5
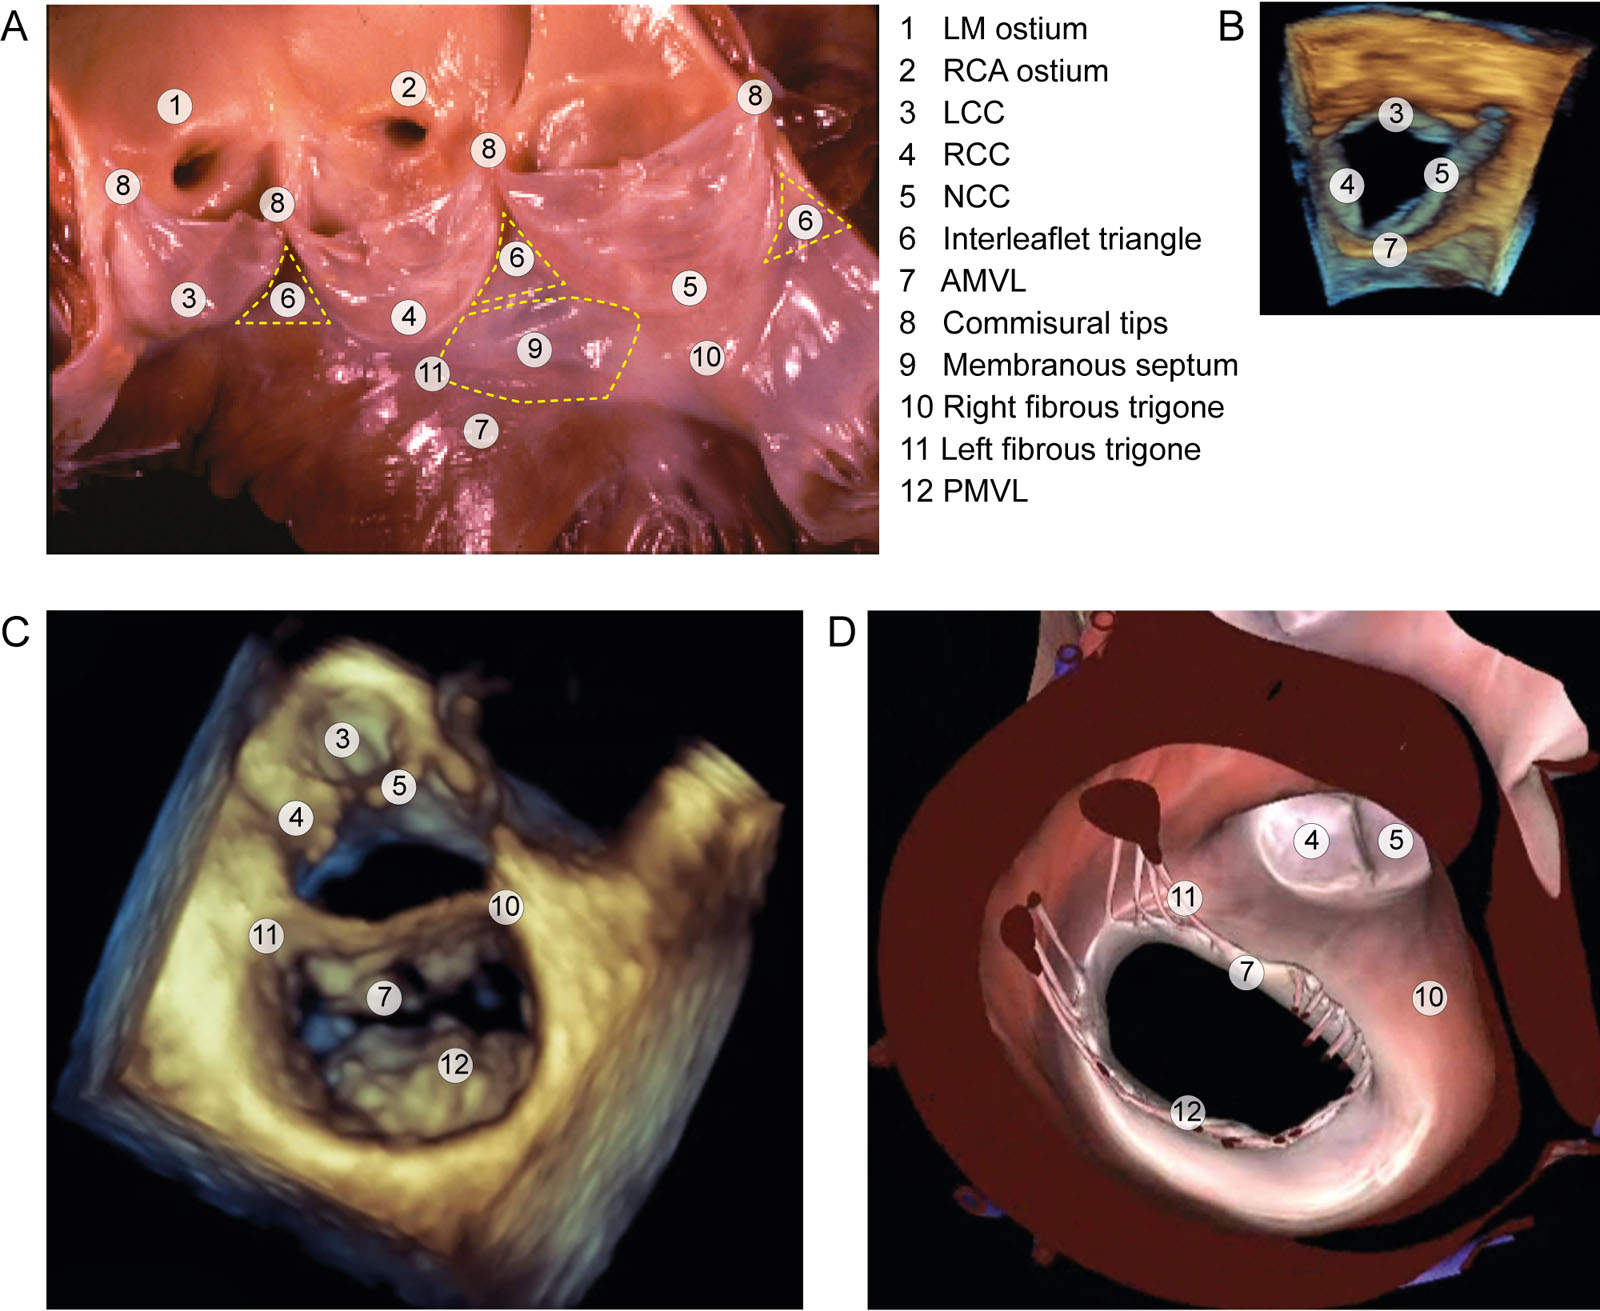
LVOT anatomy. (A) Anatomical aspect of the LVOT. The LVOT includes an anterior wall comprising the interventricular septum and membranous septum and a posterior wall, including the mitro-aortic curtain and the AMVL. The left and right trigone attach both the anterior and posterior walls and acts as a hinge mechanism for subaortic curtain movement (B-D) 3D anatomy of the LVOT from a ventricular view. Abbreviations: 3D, three-dimensional; AMVL, anterior mitral valve leaflet; LCC, left coronary cusp; LM, left main; LVOT, left ventricular outflow tract; NCC, non-coronary cusp; PMVL, posterior mitral valve leaflet; RCA, right coronary artery; RCC, right coronary cusp.
eFigure 11.9
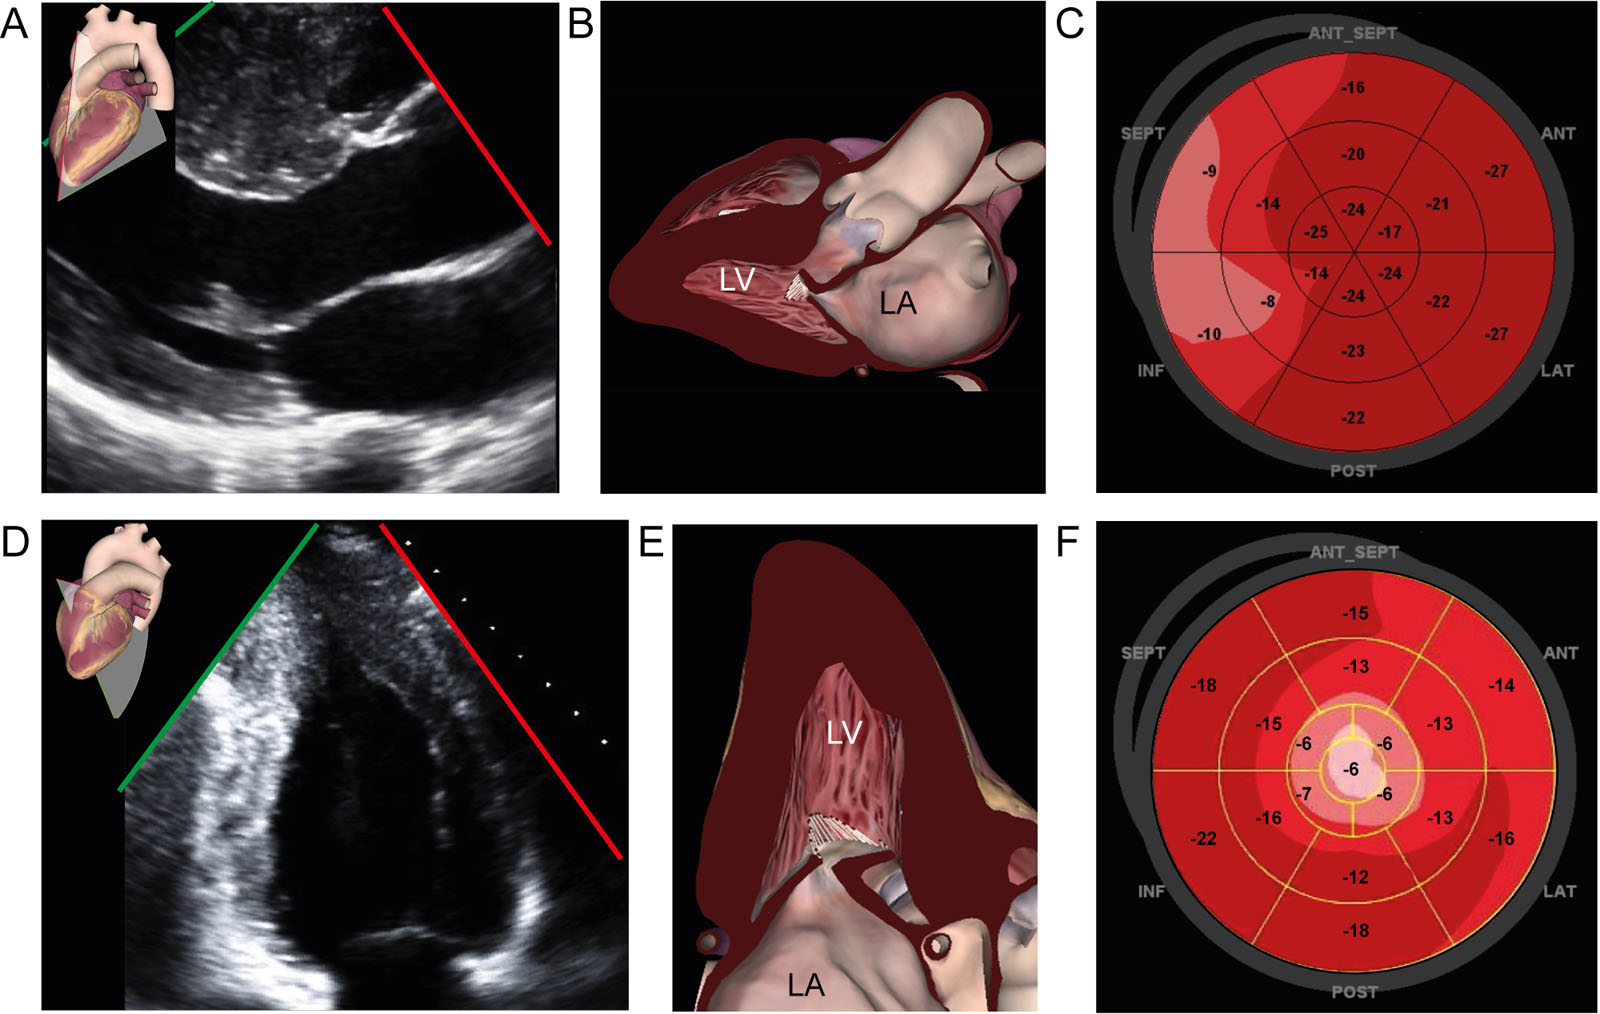
Regional strain in HCM. (A-C) A patient with septal HCM has this (A, B) TTE parasternal LAX view and corresponding (C) GLS polar map showing reduced strain in the basal septum. (D-F) A patient with apical HCM has this (D, E) TTE apical 2C view and corresponding (F) GLS strain polar map showing reduced strain in the apex. Abbreviations: 2C, two-chamber; 2D, two-dimensional; GLS, global longitudinal strain; HCM, hypertrophic cardiomyopathy; LA, left atrium; LAX, long-axis; LV, left ventricle, TTE, transthoracic echocardiography. Adapted from Nagueh et al.10
eFigure 11.11
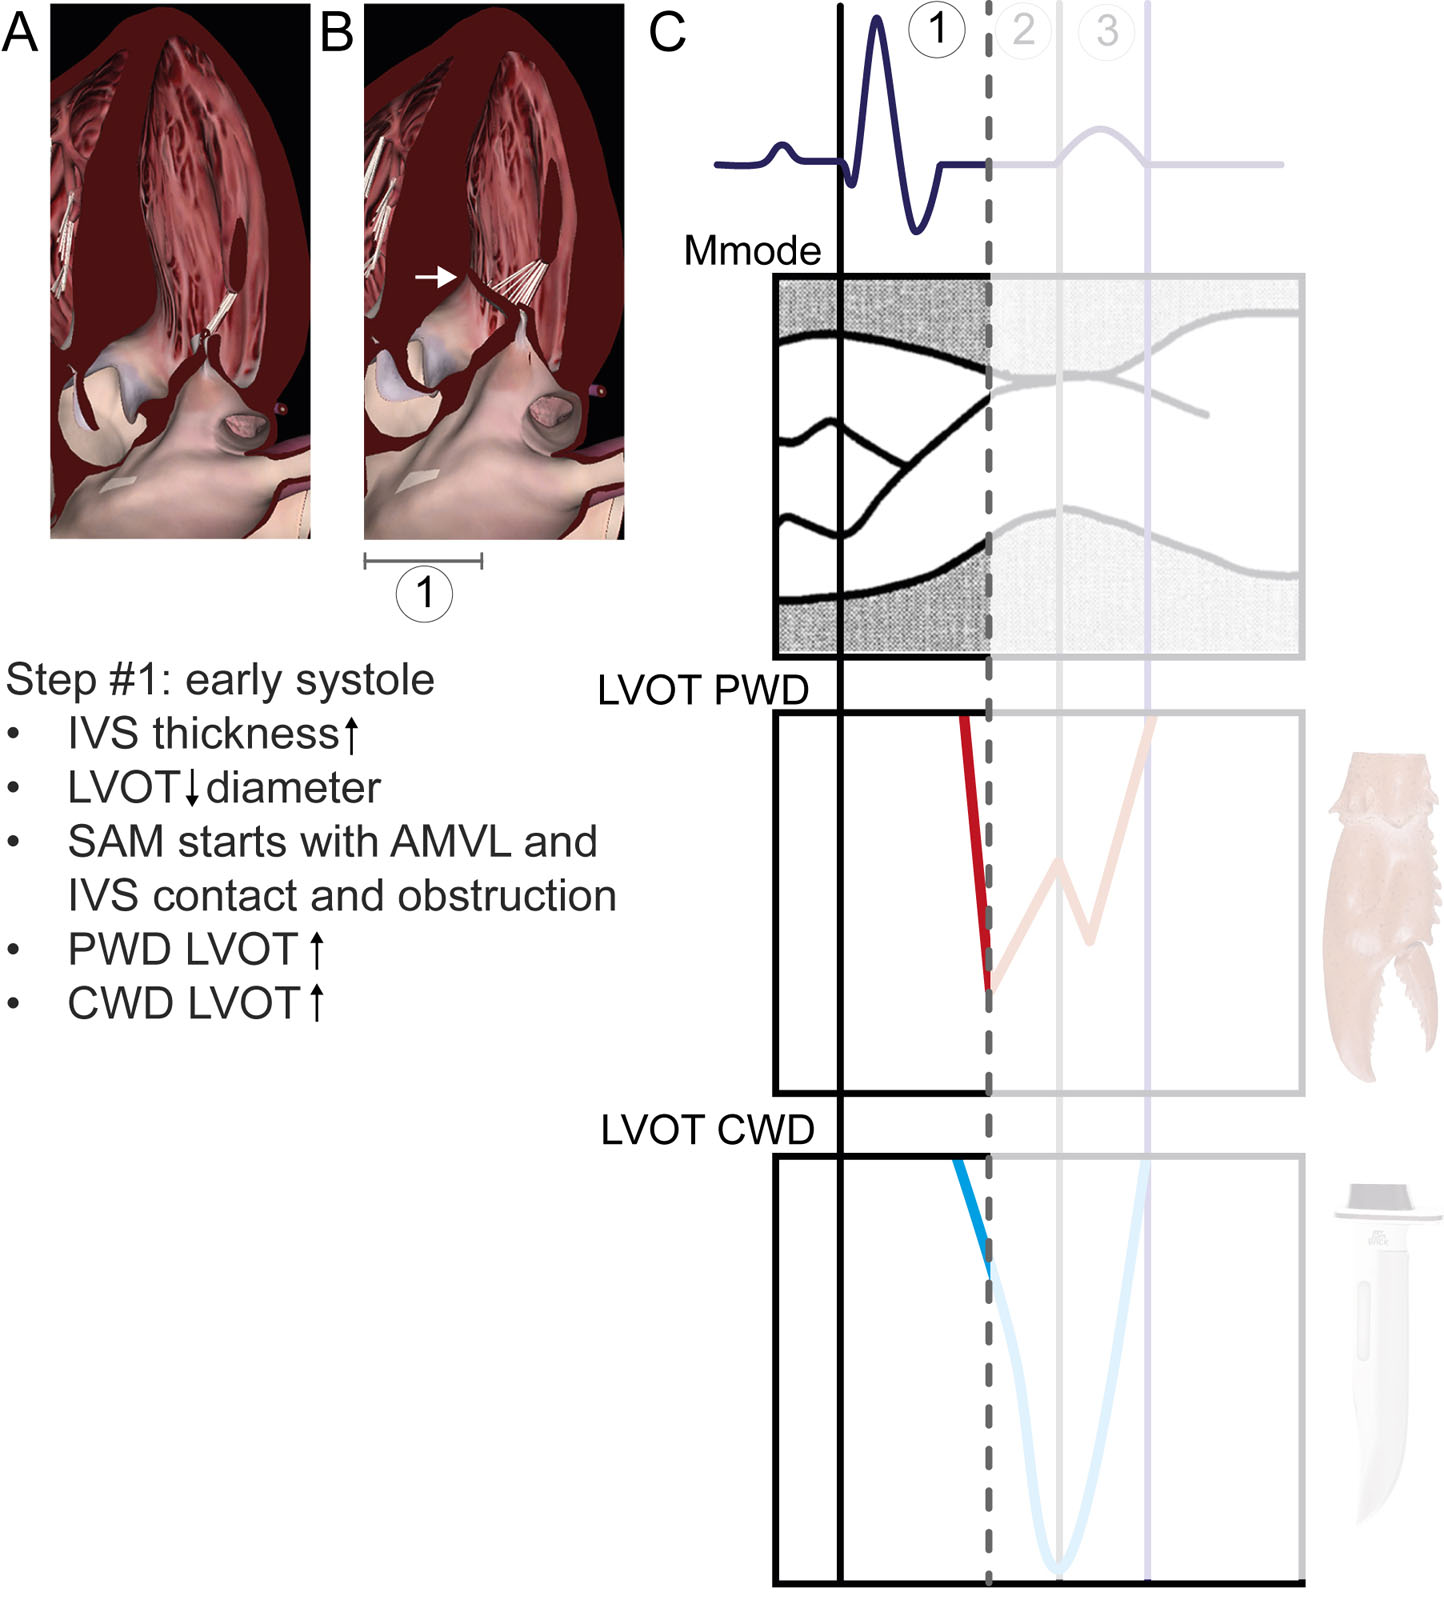
Temporal relations between ECG, M-mode and Doppler profiles in HCM #1. The time intervals related to the ECG are: 1 = Q wave to mitral-septal contact, 2 = period of AMVL and IVS contact; 3 = release of AMVL and IVS contact. (1) In early systole, there is an increase in LV flow (PWD) and LVOT flow (CWD) velocities. As IVS thickness increases and the AMVL pushes toward the IVS, SAM begins until the AMVL and IVS contact each other. Abbreviations: AMVL, anterior mitral valve leaflet; CWD, continuous-wave Doppler; ECG, electrocardiogram; HCM hypertrophic cardiomyopathy; IVS, interventricular septum; LV, left ventricular; LVOT, left ventricular outflow tract; PWD, pulsed-wave Doppler; SAM, systolic anterior motion. Adapted from Sherrid et al. 12
eFigure 11.12
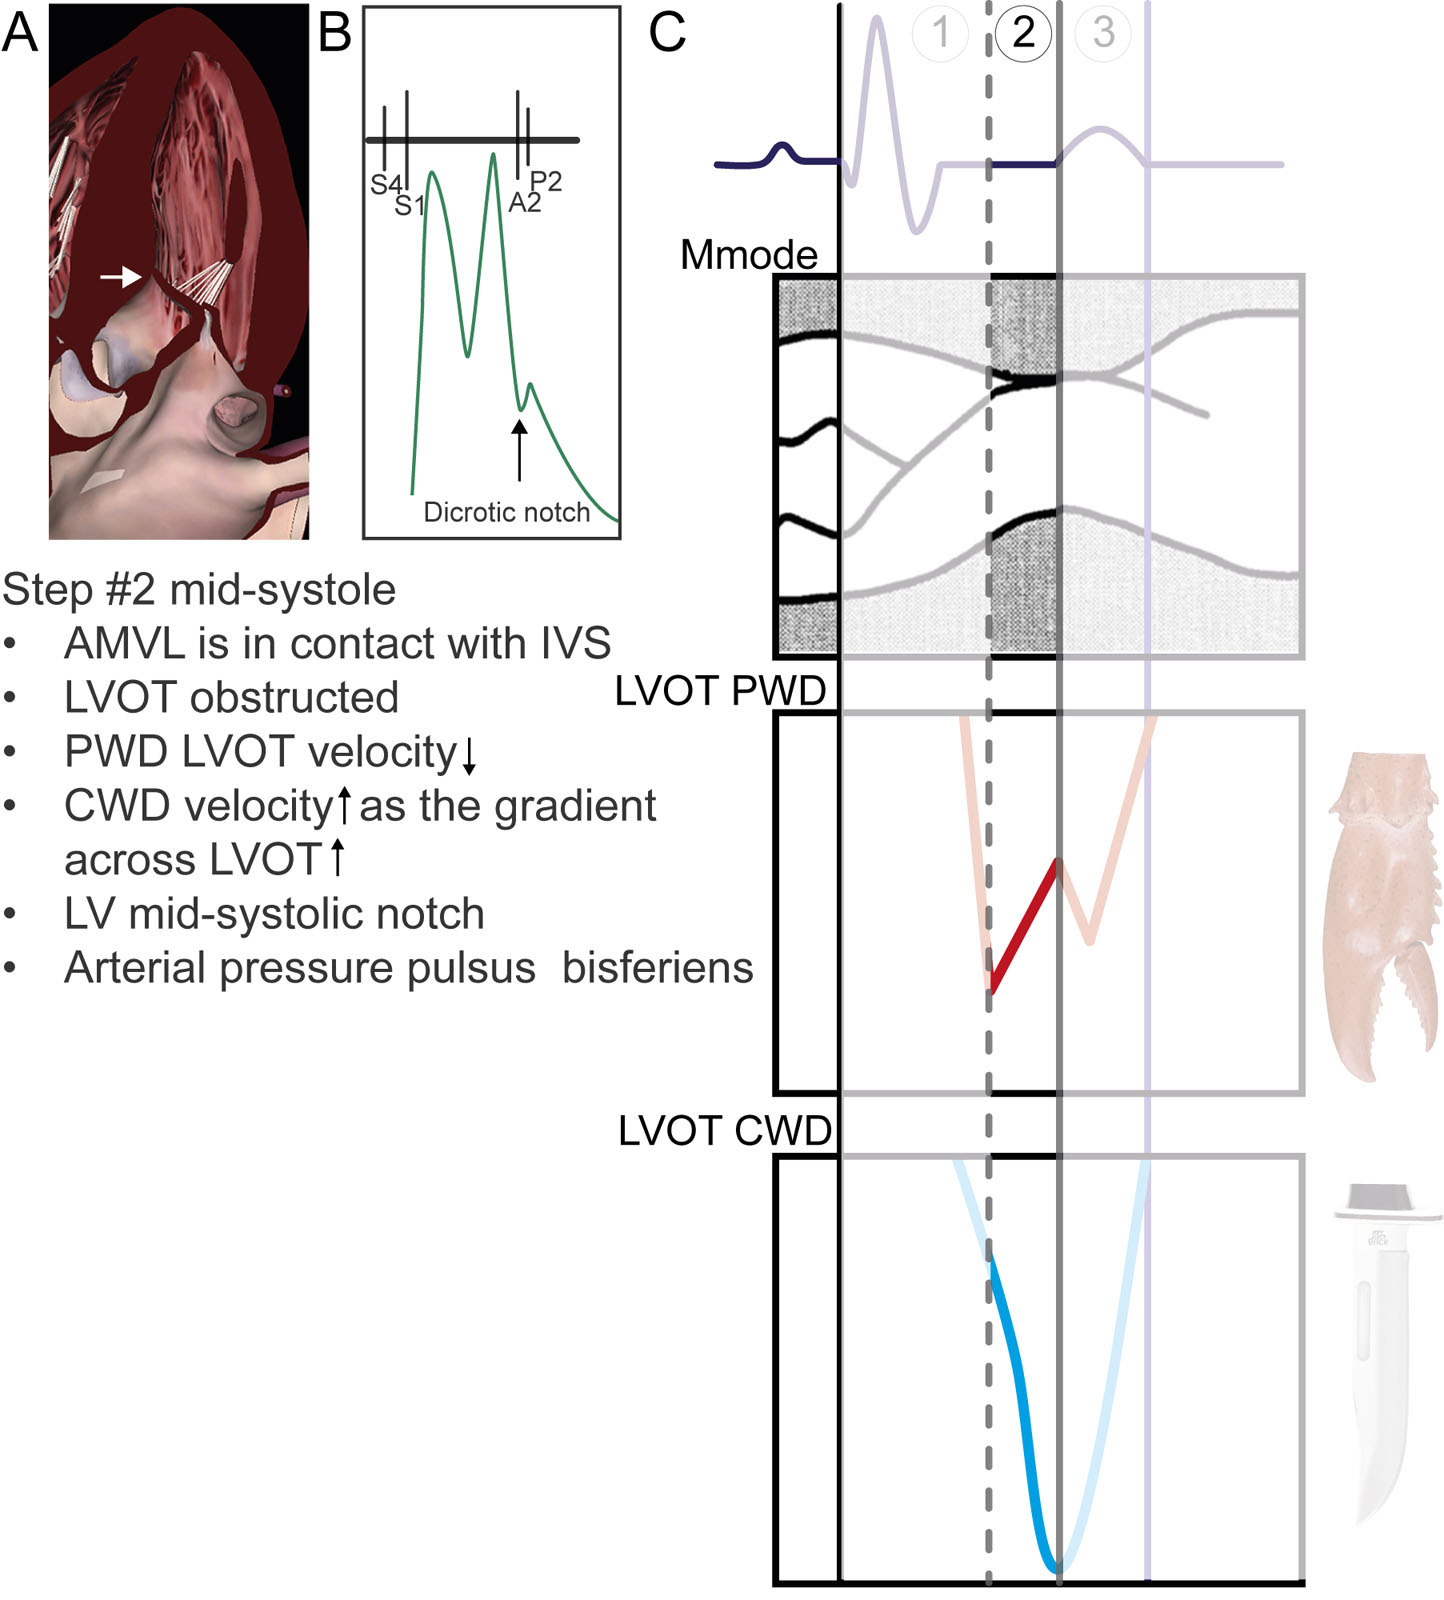
Temporal relations between ECG, M-mode and Doppler profiles in HCM #2. In mid-systole, the AMVL and IVS contact induces maximal LVOT flow obstruction, consequently, reducing upstream LV flow velocity (PWD) and increasing LVOT flow velocity (CWD). This period corresponds to the AoV mid-systolic notch and pulsus bisferiens on the arterial pressure. The dashed line is the relation between the timing of onsets of mitral septal contact and the LV early systolic velocity drop representing the first peak of the lobster claw. The straight line shows the temporal relation between mitral-septal contact, nadir of the LV velocity drop and peak LVOT velocity using CWD (bottom) or the first peak of the lobster claw. Abbreviations: AMVL, anterior mitral valve leaflet; AoV, aortic valve; CWD, continuous-wave Doppler; ECG, electrocardiogram; HCM hypertrophic cardiomyopathy; IVS, interventricular septum; LV, left ventricular; LVOT, left ventricular outflow tract; PWD, pulsed-wave Doppler. Adapted from Sherrid et al. 12
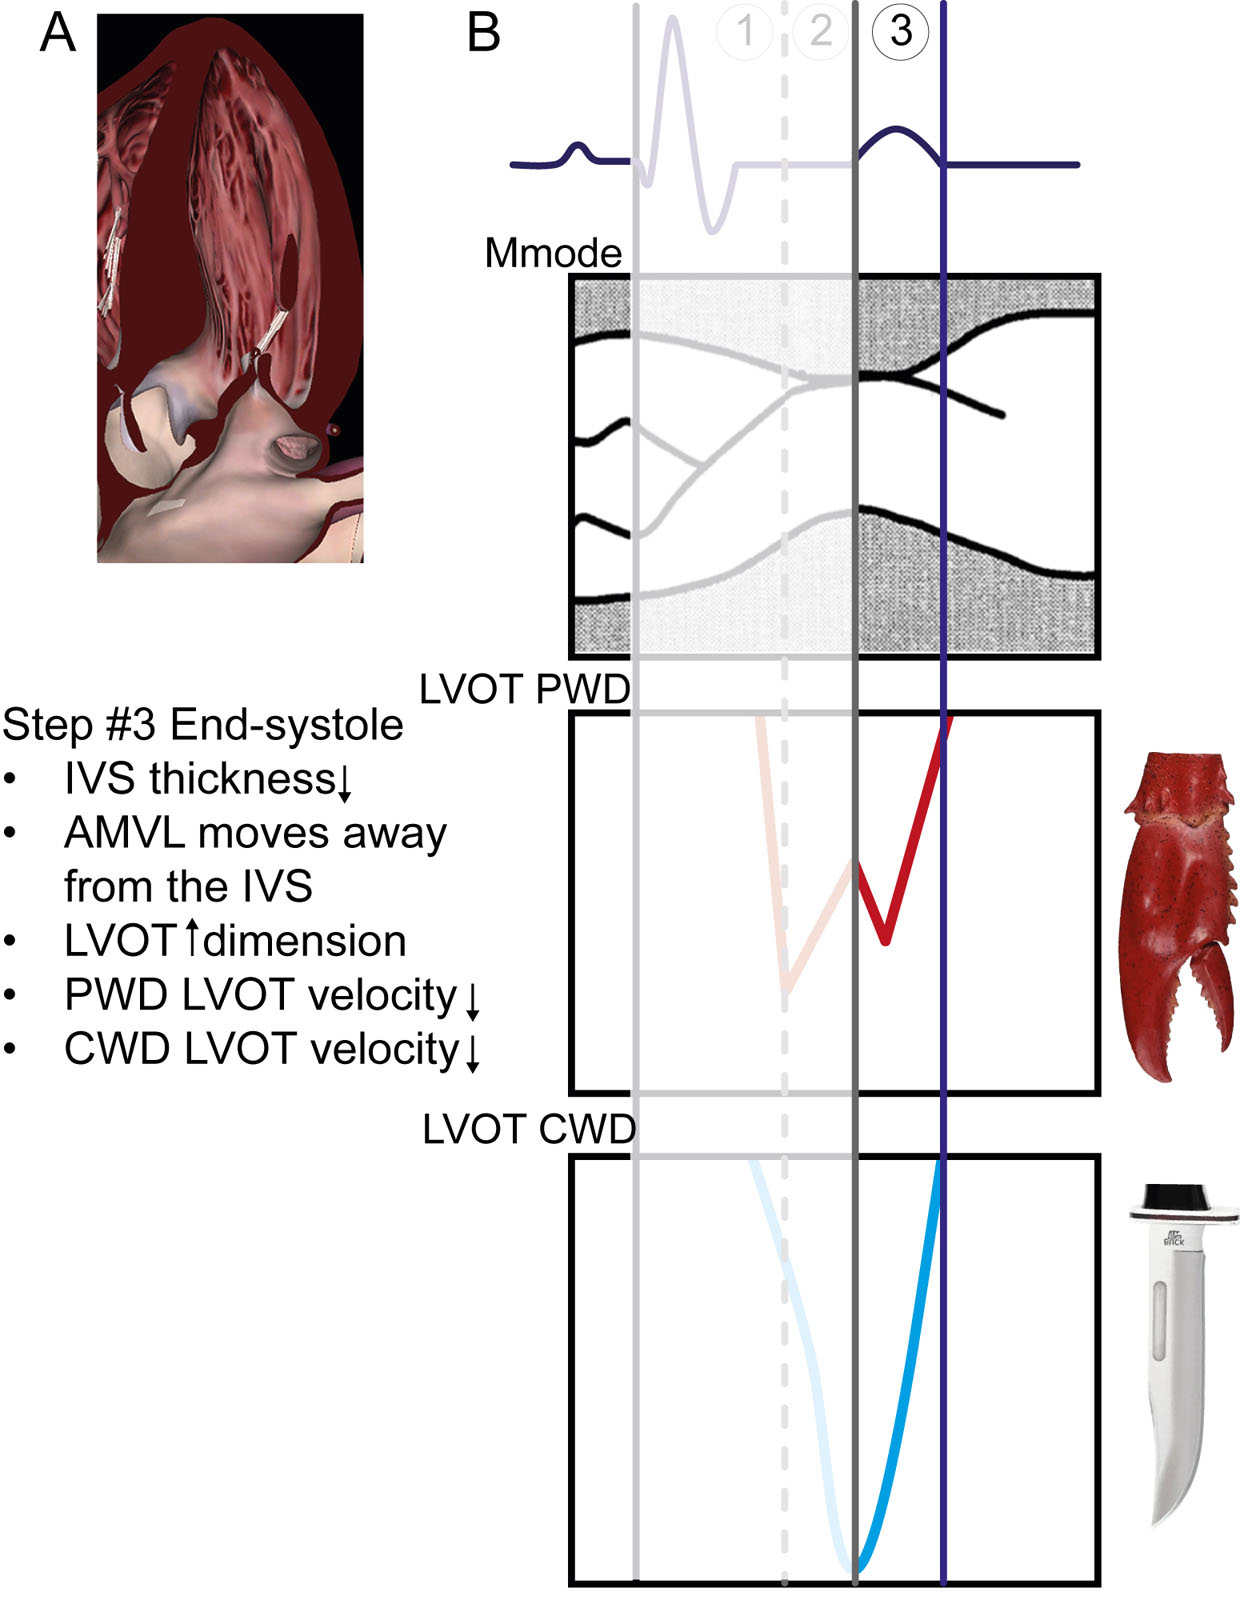
eFigure 11.13
Temporal relations between ECG, M-mode and Doppler profiles in HCM #3. In end-systole, the IVS thickness decreases and the AMVL moves away from the IVS, reducing LVOT obstruction. As a result, upstream LV flow velocity initially increases (PWD), representing the second peak of the lobster claw and then decreases to zero as the LV cavity empties. As the LVOT dimension increases, the LV cavity empties, reducing LVOT flow velocity (CWD). Abbreviations: AMVL, anterior mitral valve leaflet; CWD, continuous-wave Doppler; ECG, electrocardiogram; HCM hypertrophic cardiomyopathy; IVS, interventricular septum; LV, left ventricular; LVOT, left ventricular outflow tract; PWD, pulsed-wave Doppler. Adapted from Sherrid et al. 12
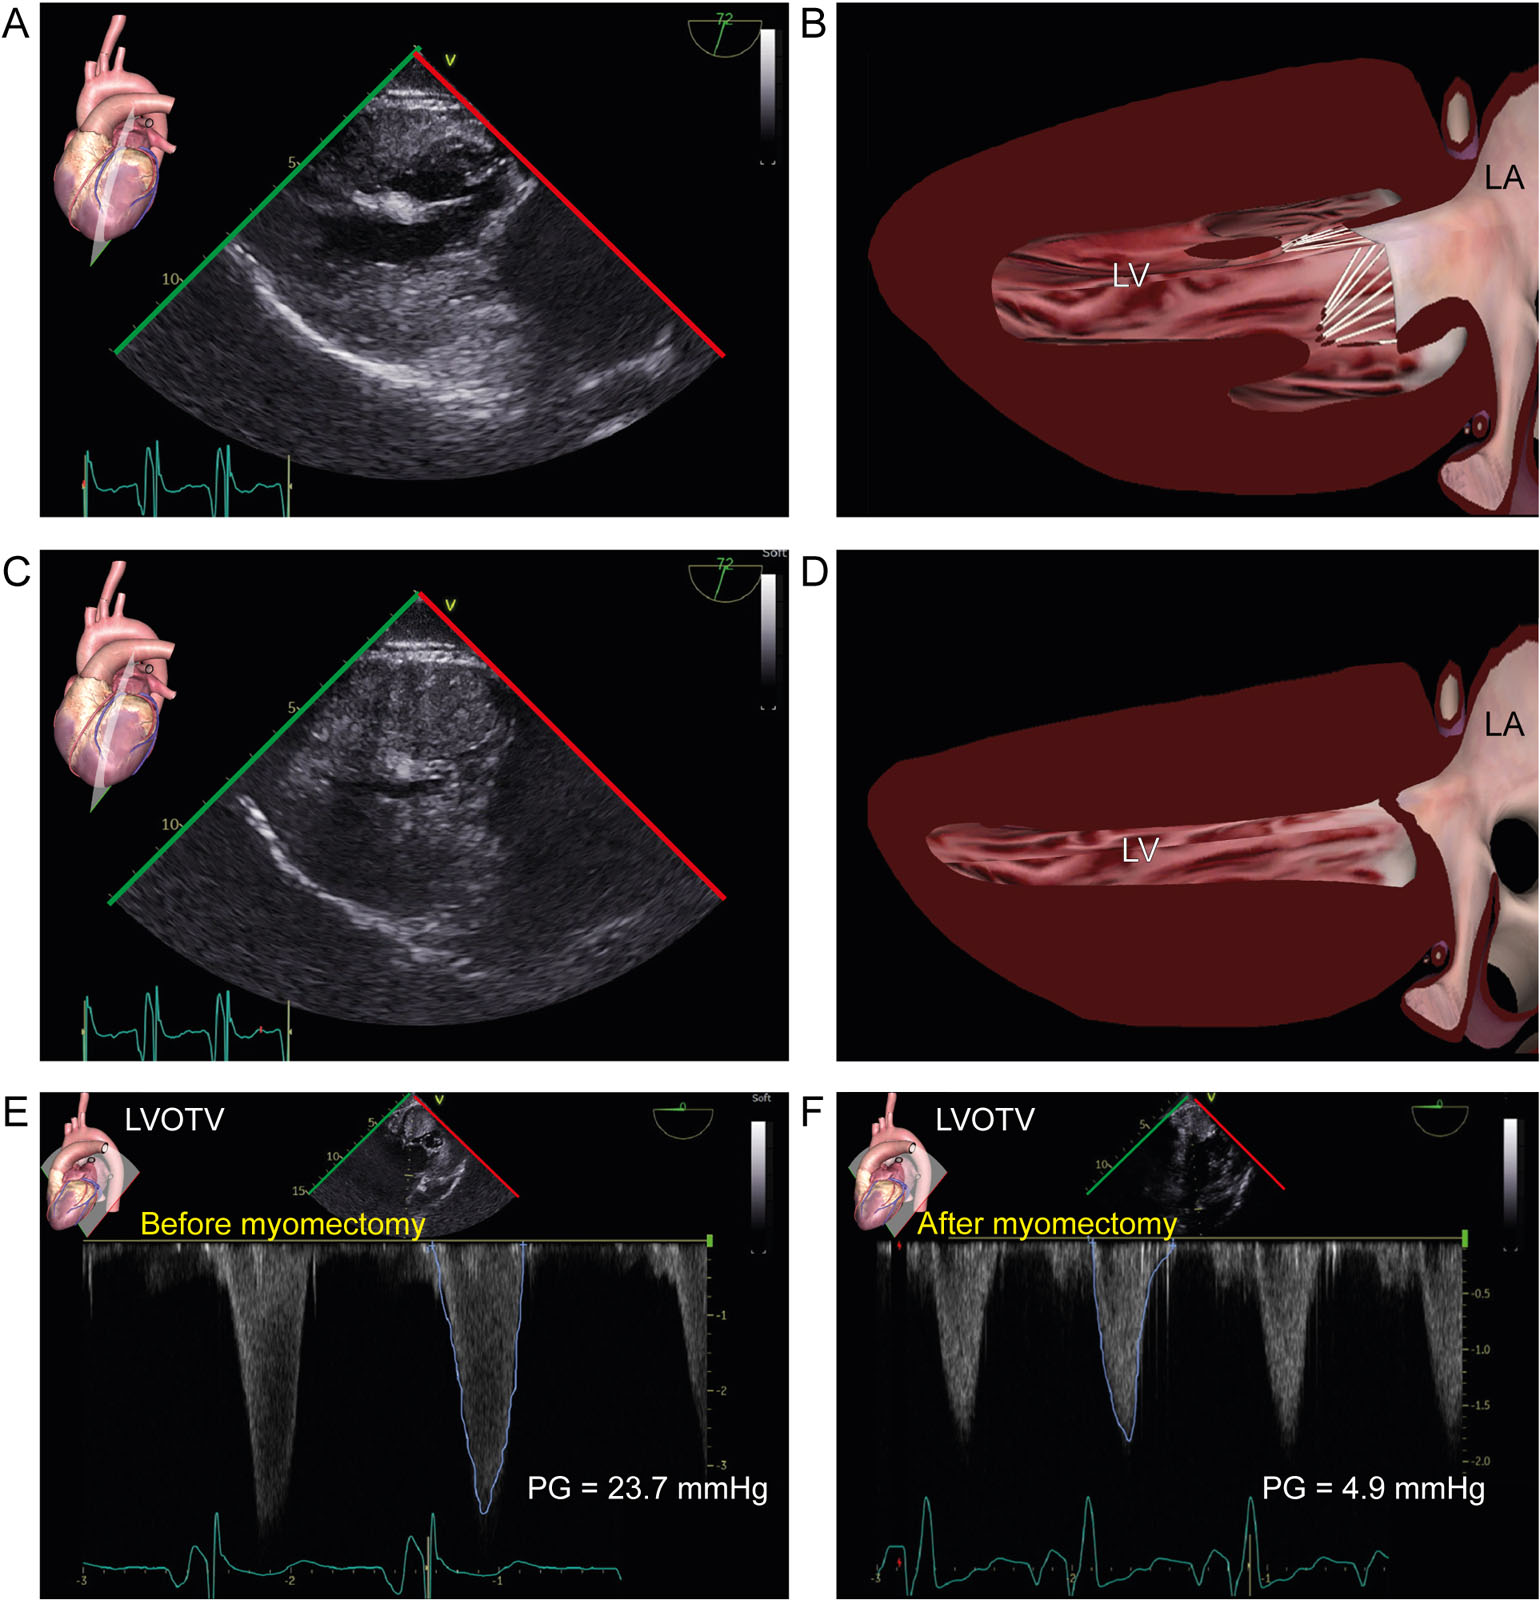
eFigure 11.15
Diffuse HCM. TG 2C views in (A, B) diastole show diffuse LV hypertrophy and in (C, D) systole LV cavity obliteration in a 18-year-old woman with diffuse HCM. (E, F) After myomectomy, there was a significant reduction in the mean PG across the LVOT in the DTG views. Abbreviations: 2C, two-chamber; DTG, deep transgastric; HCM, hypertrophic cardiomyopathy; LA, left atrium; LV, left ventricular; LVOTV, left ventricular outflow tract velocity; PG, pressure gradient; TG, transgastric.
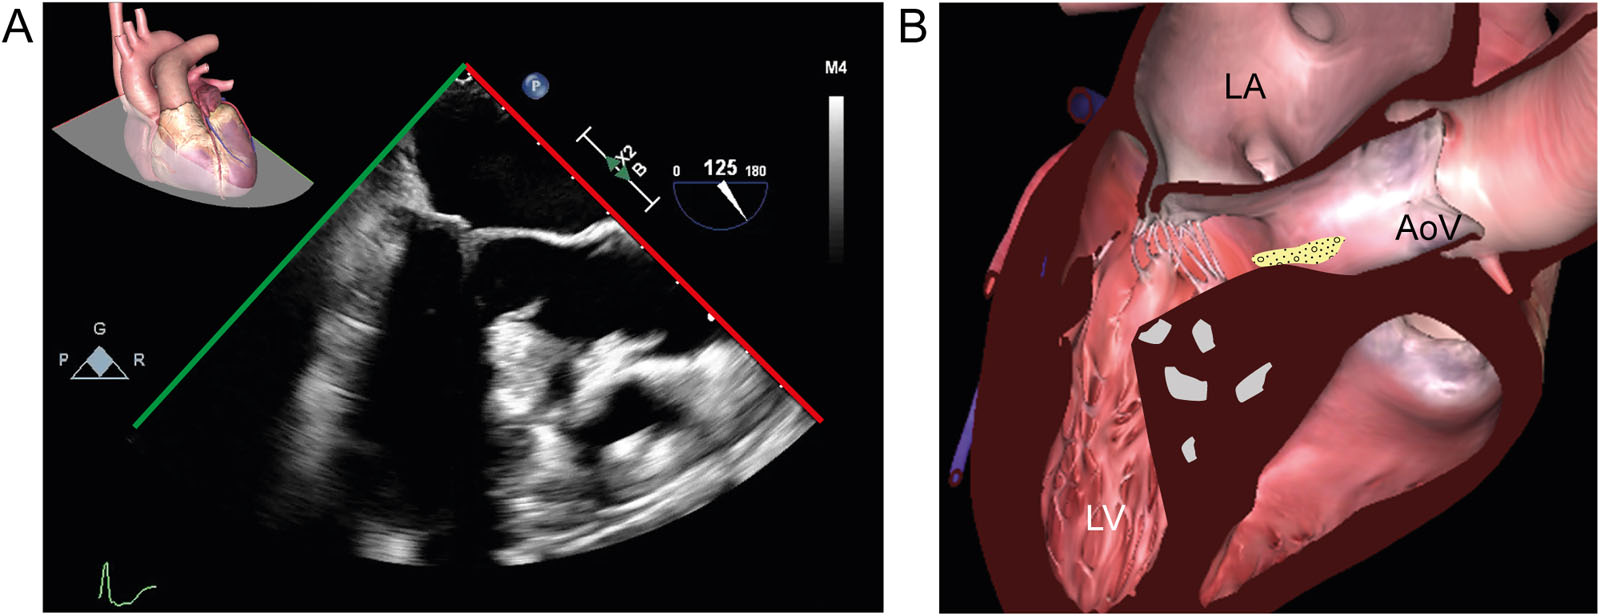
eFigure 11.17
HCM and fibroelastoma. (A, B) ME LAX view in a 59-year-old woman with HCM shows increased zones of echogenicity of the IVS. In addition, there was an unexpected finding of a mobile mass in the LVOT attached to the IVS. Pathology confirmed that it was a fibroelastoma. Abbreviations: AoV, aortic valve; HCM, hypertrophic cardiomyopathy; IVS, interventricular septum; LA, left atrium; LAX, long-axis; LV, left ventricle; LVOT, left ventricular outflow tract; ME, mid-esophageal.
eFigure 11.23
HCM and SAM. The diagrams of the mitral commissural view show how medial displacement of hypertrophied PMs promotes SAM of the AMVL. (A) This diagram shows normal PMs and chords attached to the AMVL. (B) In PM hypertrophy, there is a reduction in inter-PM distance from medial displacement, which decreases the distance between the PM tips and the AMVL A2 segment, selectively reducing central chordal tension. Abbreviations: AMVL, anterior mitral valve leaflet; HCM, hypertrophic cardiomyopathy; LA, left atrium; LV, left ventricle; LVOT, left ventricular outflow tract; PMs, papillary muscles; SAM, systolic anterior motion. Adapted from Silbiger et al.44
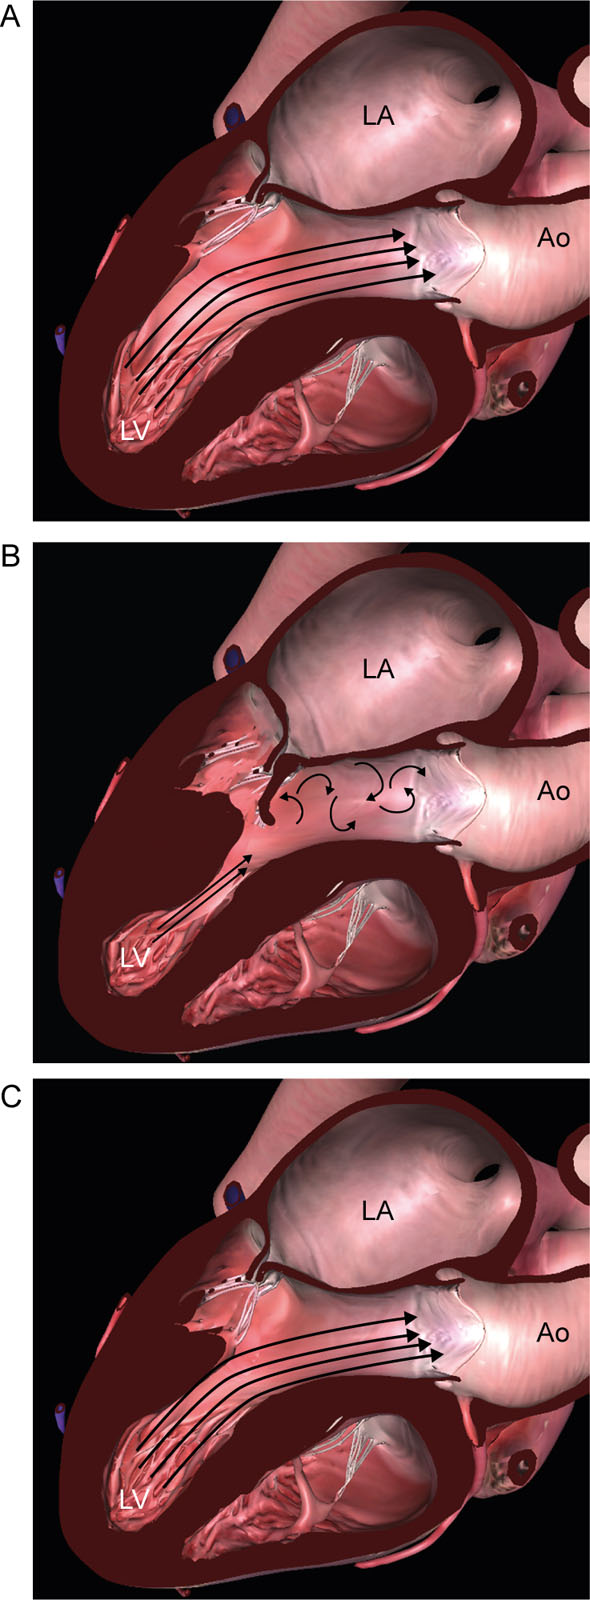
eFigure 11.24
PM surgical release. Diagrams of the ME LAX view showing the effect of surgical release of the PMs. (A) This diagram shows normal PMs size and position with laminar LVOT flow. (B) Diagram showing hypertrophied anteriorly displaced PMs causing chordal slack allowing the AMVL to be swept into the LVOT, creating turbulent LVOT flow during LV ejection. (C) This diagram is after surgical trimming and release of the PMs from the underlying LV wall. This allows the mitral apparatus to assume a more physiologic posterior position, restoring laminar LVOT flow. Abbreviations: AMVL, anterior mitral valve leaflet; Ao, aorta; LA, left atrium; LAX, long-axis; LV, left ventricle; LVOT, left ventricular outflow tract; ME, mid-esophageal; PMs, papillary muscles. Adapted from Silbiger et al.44
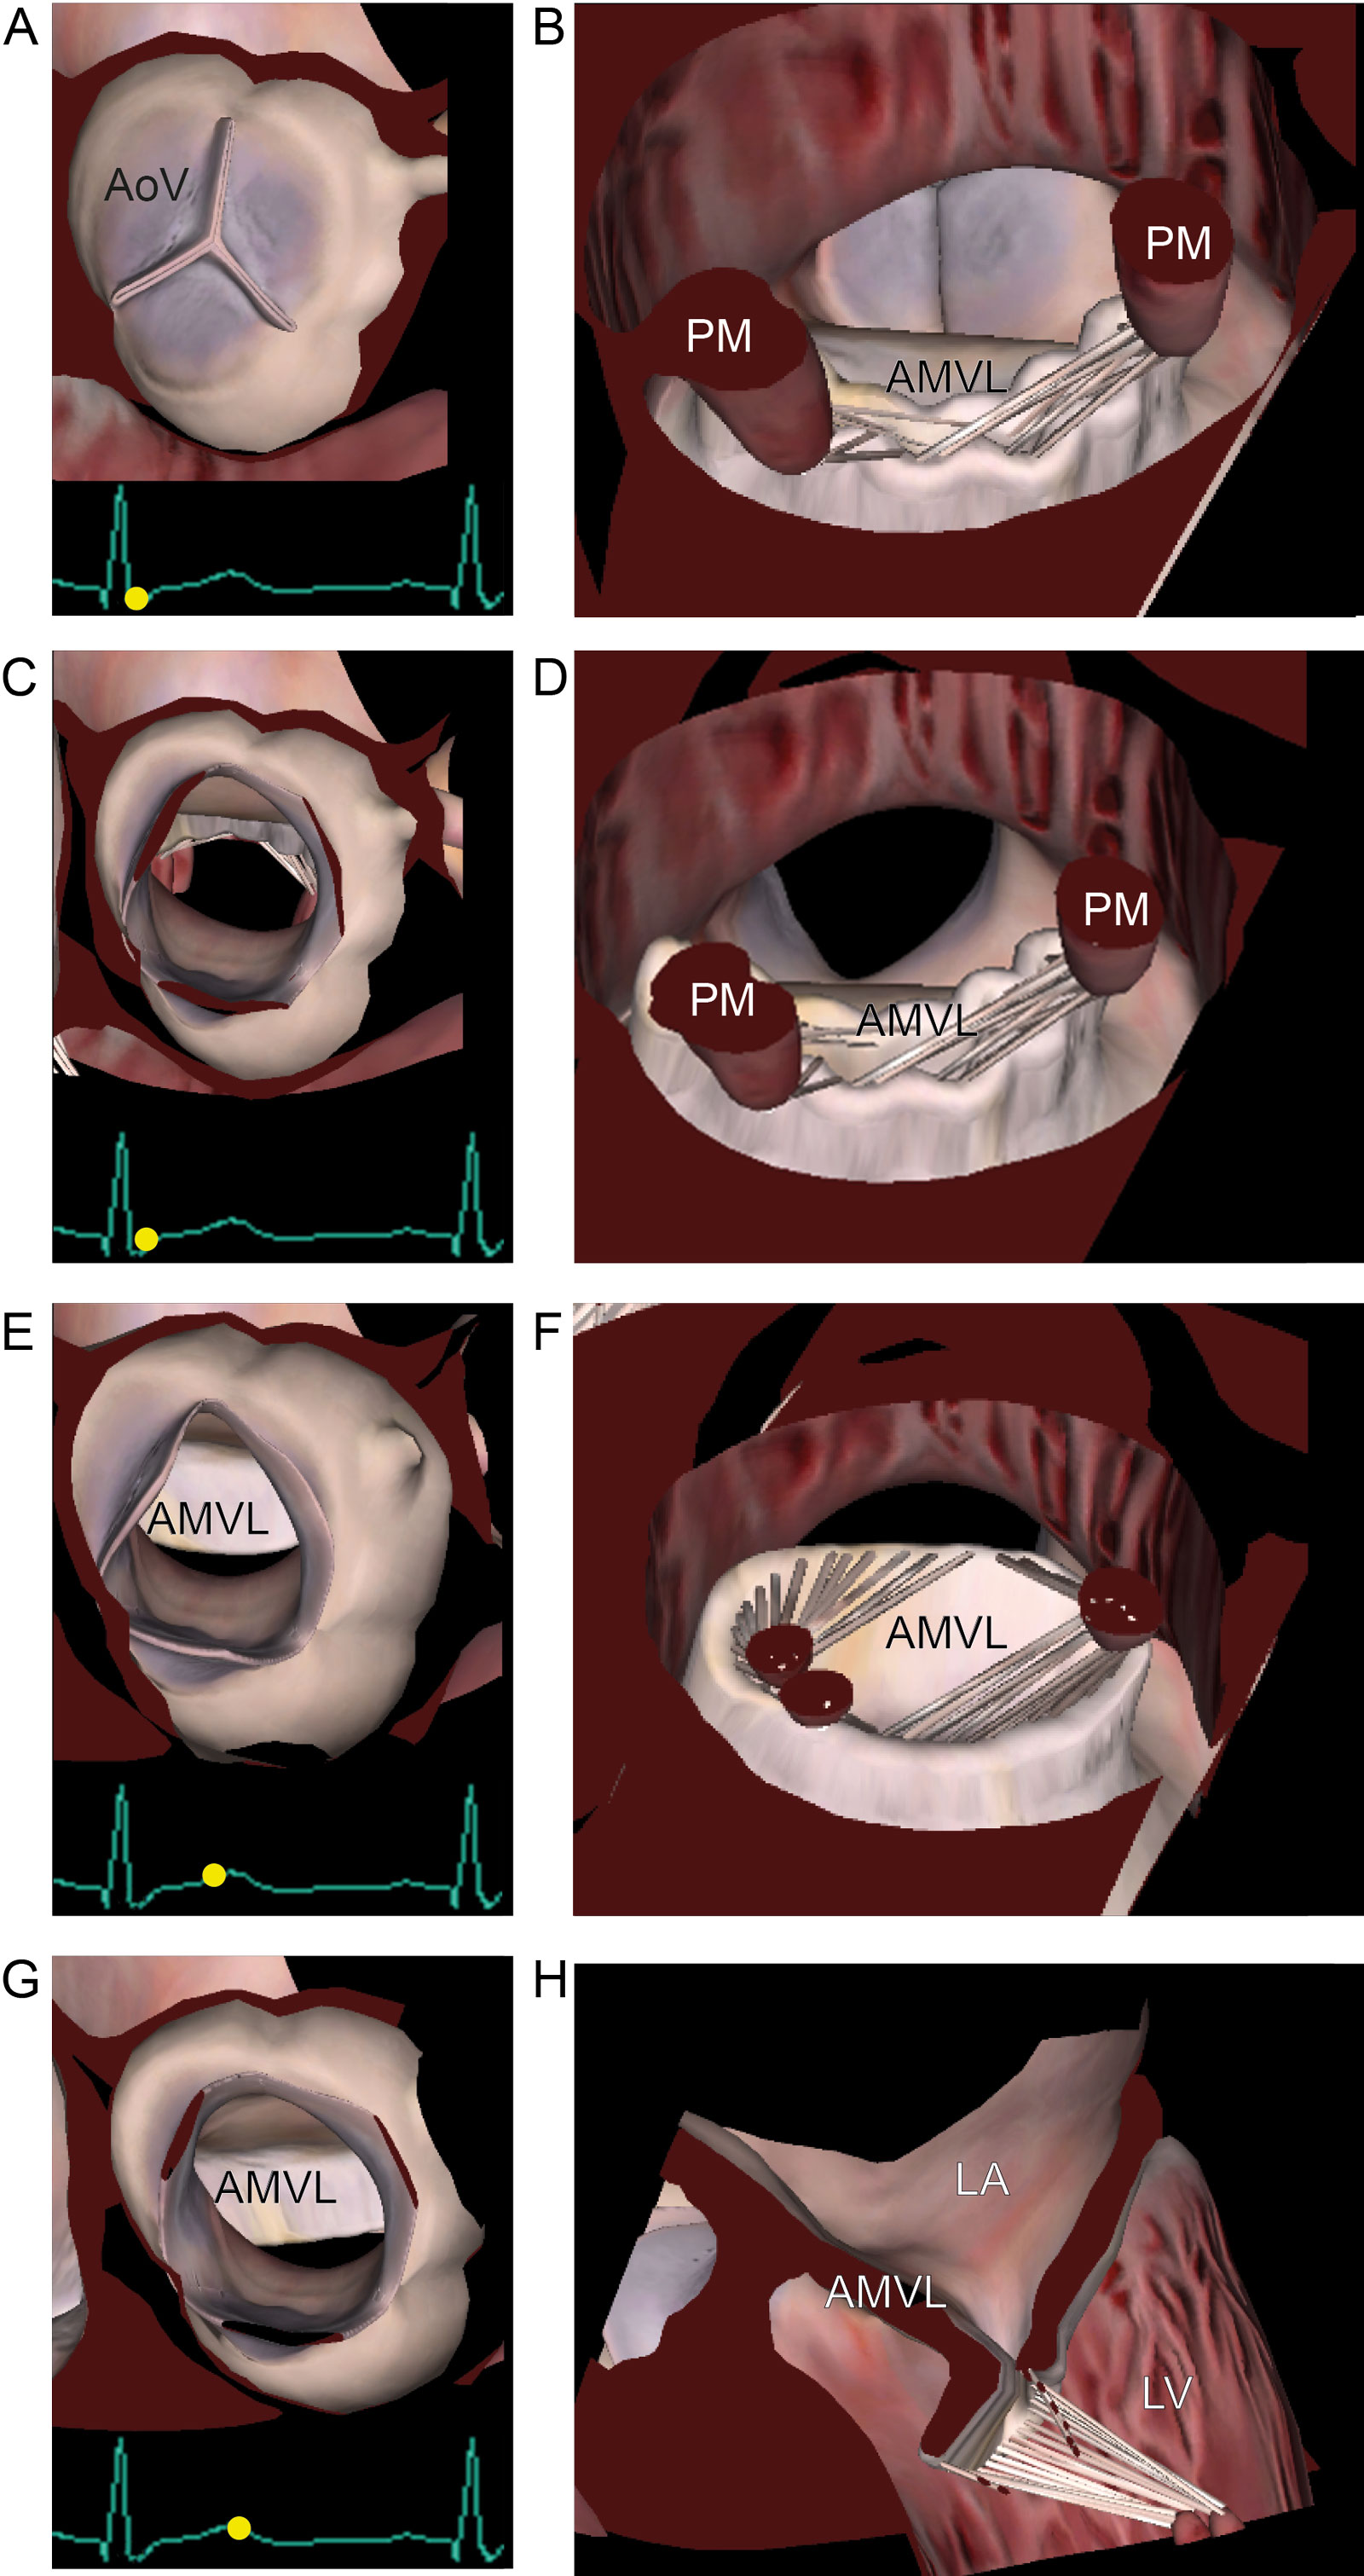
eFigure 11.26
HCM and SAM. Schematic representation of (A-D) AoV valve view and (E-H) LVOT view of SAM. Reduction of AoV opening downstream the SAM in late-systole. Note the LVOT obstruction by the AMVL. Abbreviations: AMVL, anterior mitral valve leaflet; AoV, aortic valve; HCM, hypertrophic cardiomyopathy; LA, left atrium; LV, left ventricle; PMs, papillary muscles; SAM, systolic anterior motion. Adapted from Silbiger et al.44
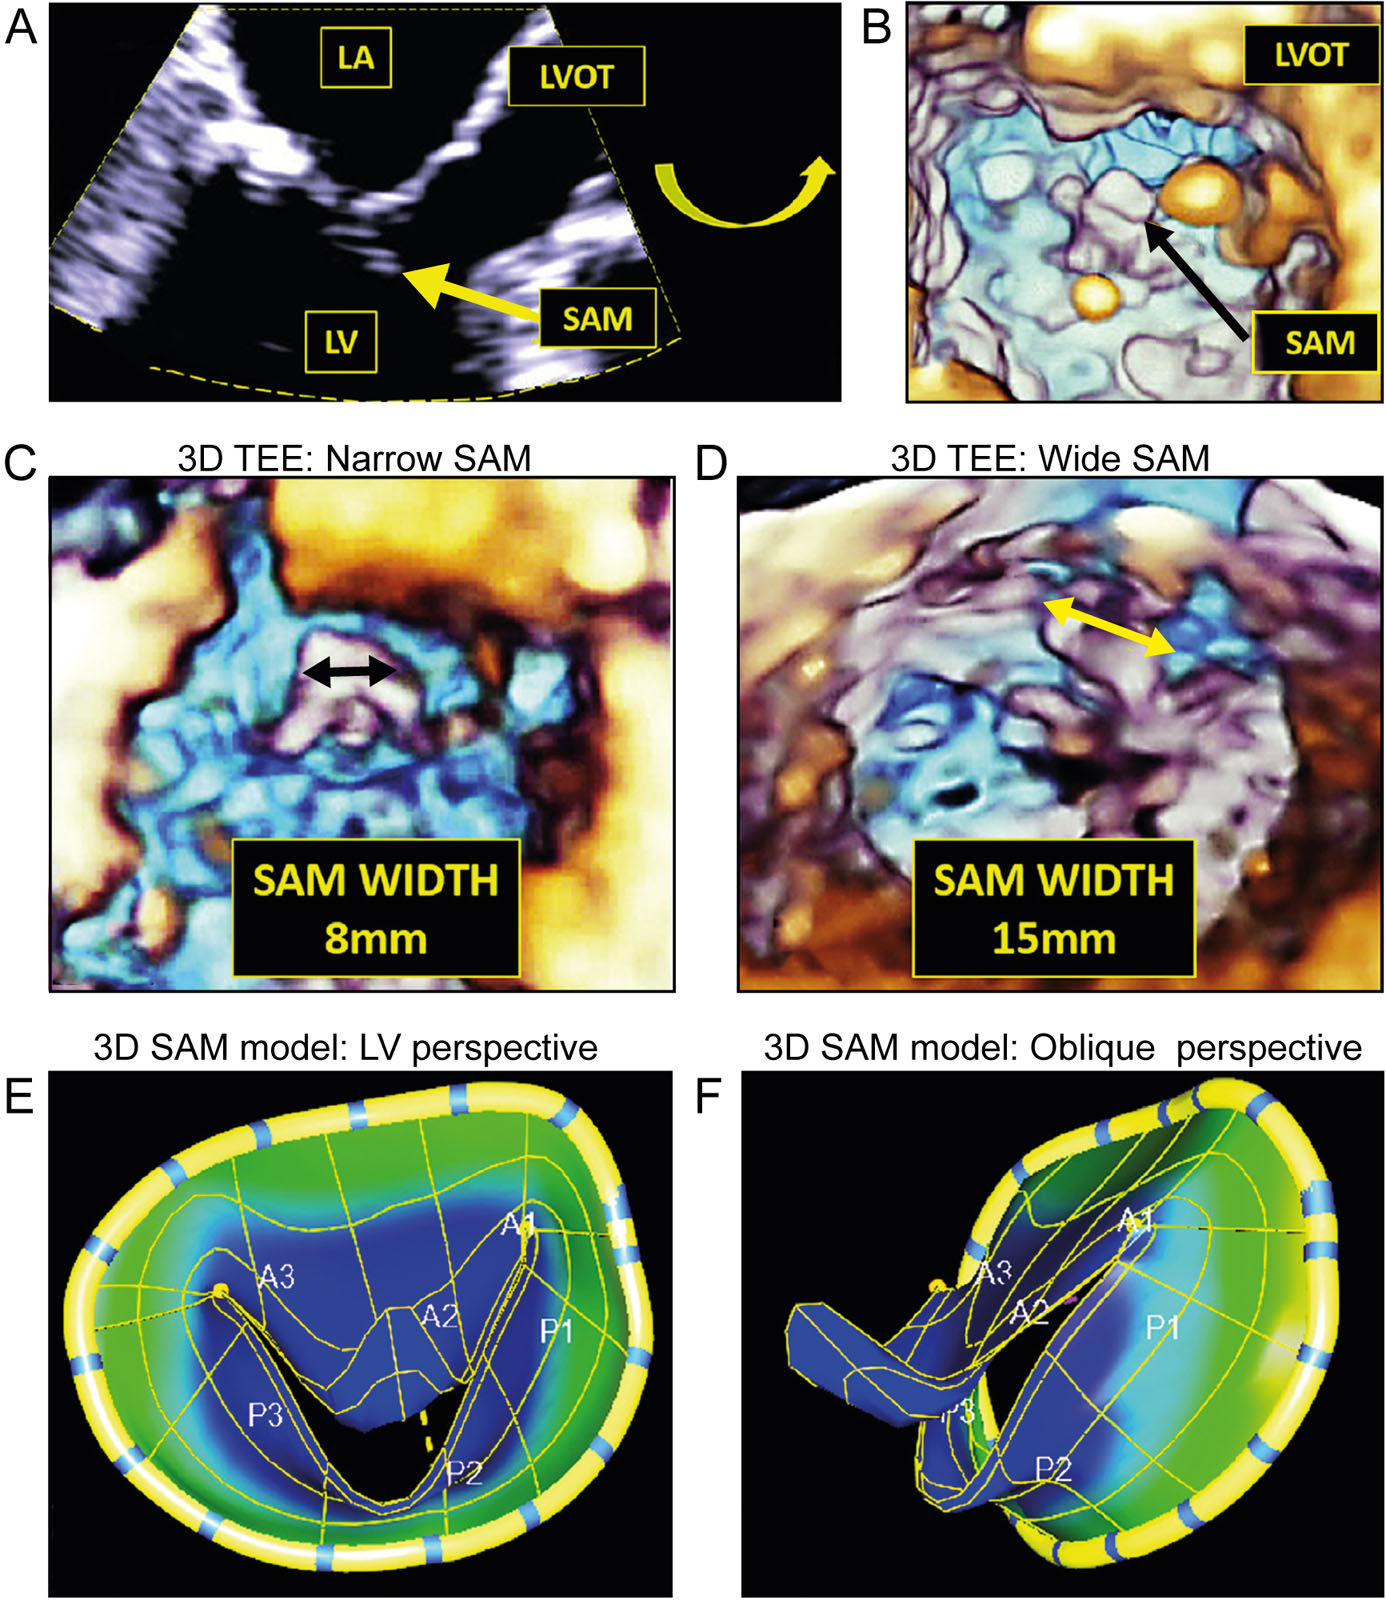
eFigure 11.27
3D SAM ROI acquisition. (A) 2D ME AoV LAX view. The ROI for 3D zoom is represented by the dotted yellow line. Selecting the proper ROI is the critical first step for creating an optimal 3D image of SAM (yellow arrow). Note adequate depth to capture SAM and adequate azimuth width to capture full LVOT. (B) 3D of SAM and LVOT from LV perspective. Note the 3D image has been tilted upward to better reveal SAM and LVOT. (C) 3D TEE in SAM LVOT view demonstrating narrow SAM width of 8 mm. (D) 3D TEE in SAM LVOT view demonstrating wide SAM width of 15 mm. (E) 3D SAM model from LV/en face perspective. (F) 3D SAM model from an oblique perspective. This technology, available commercially using Esie Valves software (Siemens Healthineers), avoids 3D dropout and side lobe artifacts and creates static and dynamic models of SAM. Note the similarity with a Dolphin smile. Abbreviations: 2D, two-dimension; 3D, three-dimension; AoV, aortic valve; LA, left atrium; LAX, long-axis; LV, left ventricular; LVOT, left ventricular outflow tract; ME, mid-esophageal; ROI, region of interest; SAM, systolic anterior motion; TEE, transesophageal echocardiography. Adapted from Vainrib et al.53
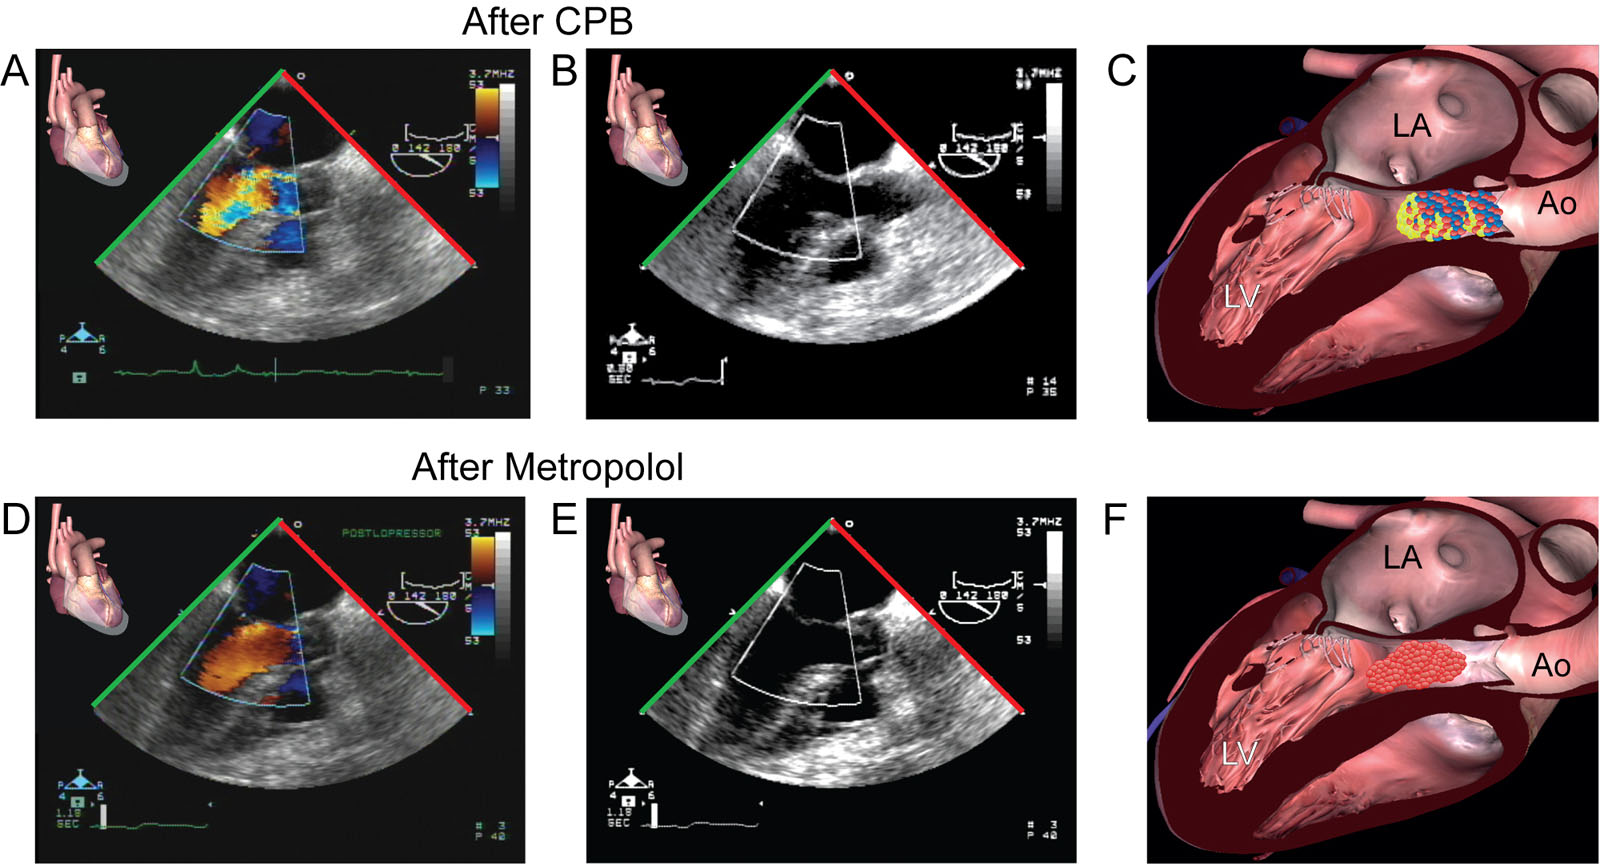
eFigure 11.29
Metoprolol and LVOT obstruction. (A–C) ME LAX views with CFI show SAM with flow acceleration in the LVOT in a 63-year-old hemodynamically unstable woman immediately after CPB for coronary revascularization. (D–F) There was a clinical improvement after administrating an intravenous bolus of metoprolol with a reduction in CFI turbulence and increase cardiac dimension as a result of reduce heart rate. Abbreviations: Ao, aorta; CFI, color flow imaging; CPB, cardiopulmonary bypass; LA, left atrium; LAX, long-axis; LV, left ventricle; LVOT, left ventricular outflow tract; ME, mid-esophageal; SAM, systolic anterior motion.
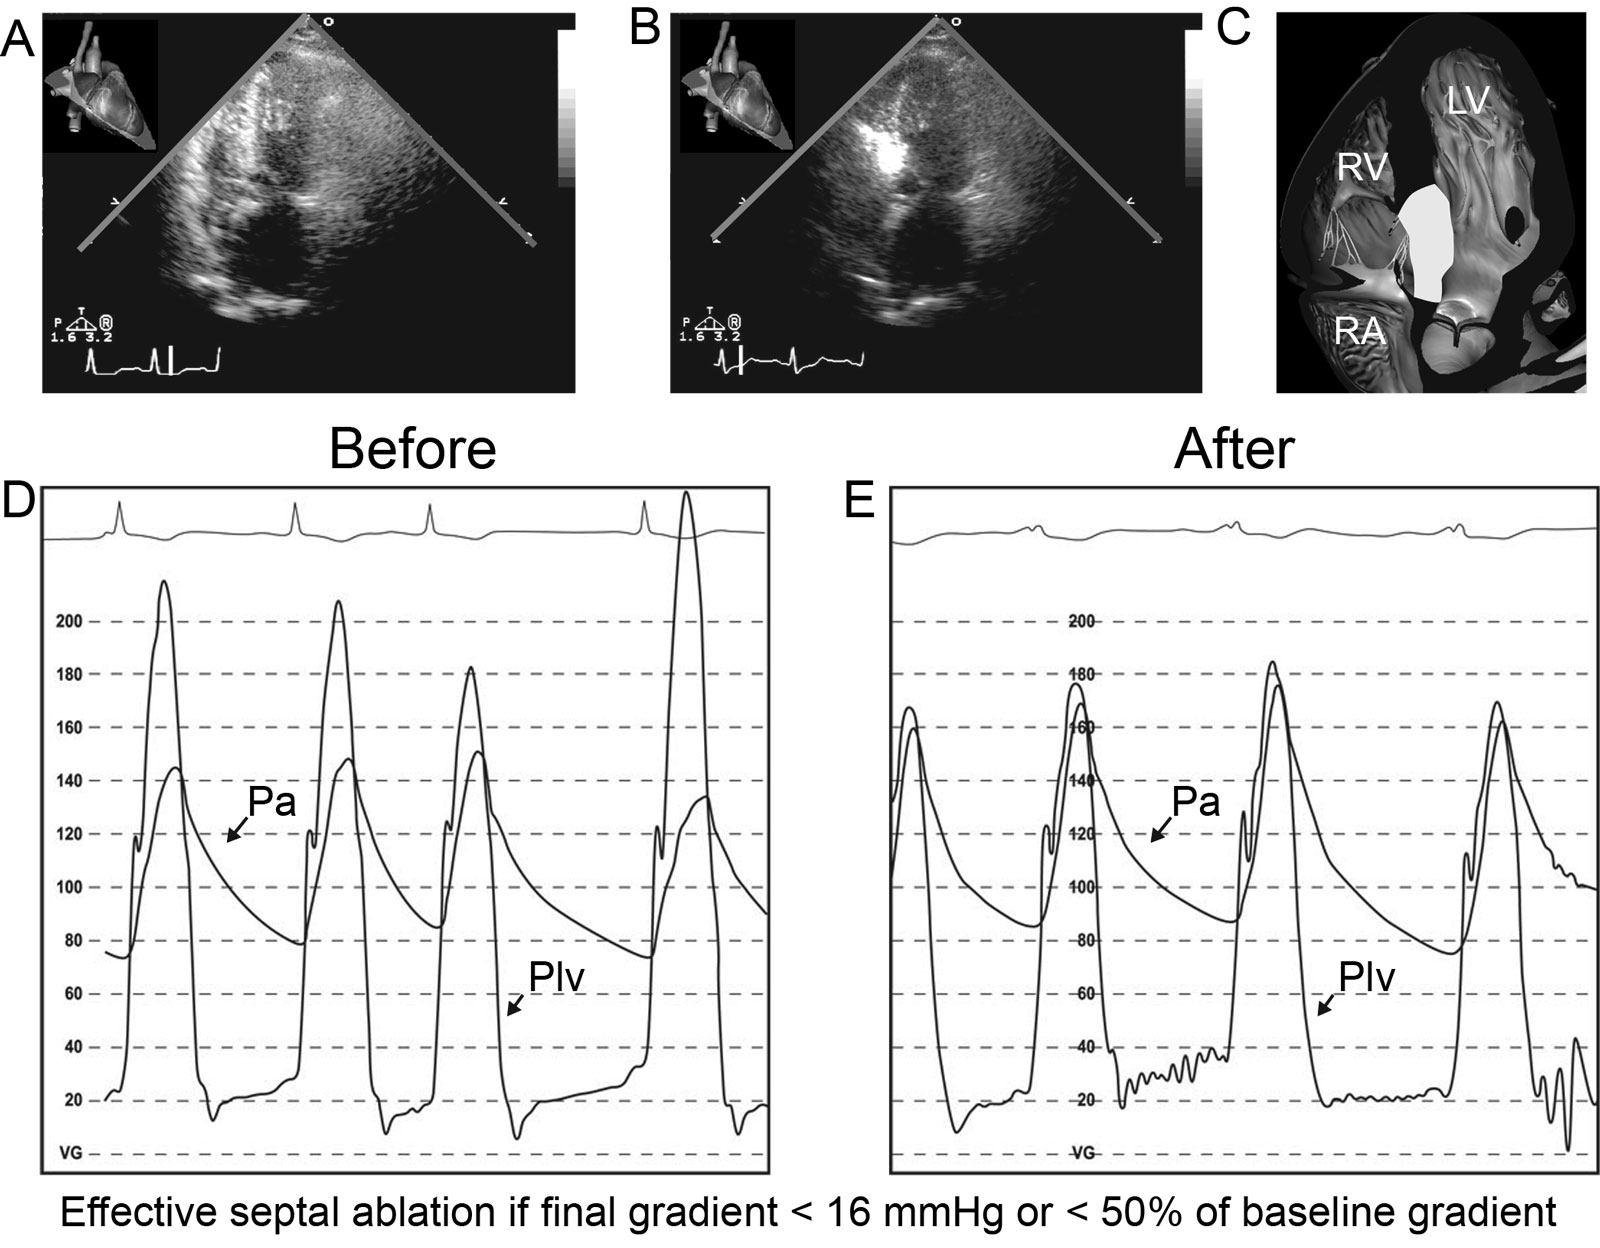
eFigure 11.31
Percutaneous alcohol septal ablation. (A-C) These are TTE apical 5C views before and during the procedure. Myocardial contrast enhancement of the brightened septal area confirms that the septal branch to be injected is indeed the one providing the vascular supply to the SAM septal contact region. (D, E) Hemodynamic tracings (D) before and (E) immediately after percutaneous alcohol septal ablation show an improved resting systolic PG. Abbreviations: 5C, five-chamber; LV, left ventricle; Pa, arterial pressure; PG, pressure gradient; Plv, left ventricular pressure; RA, right atrium; RV, right ventricle; SAM, systolic anterior motion; TTE, transthoracic echocardiography
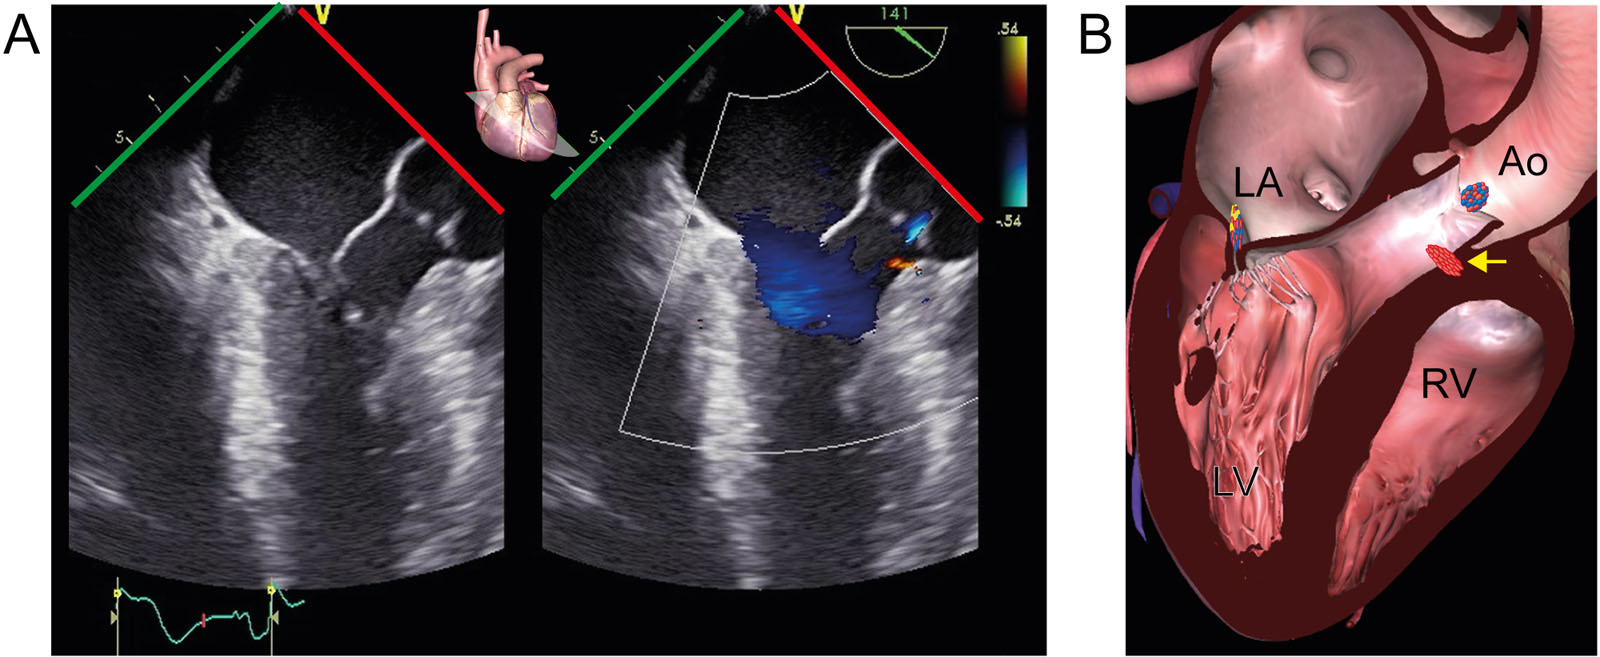
eFigure 11.34
Septal perforator. (A, B) ME LAX color-compare view with CFI during diastole post-myomectomy for HCM shows a septal perforator in the proximal IVS (arrow) at the same time as the trace of AR. Abbreviations: Ao, aorta; AR, aortic regurgitation; CFI, color flow imaging; HCM, hypertrophic cardiomyopathy; IVS, interventricular septum; LA, left atrium; LAX, long-axis; LV, left ventricle; ME, mid-esophageal; RV, right ventricle.
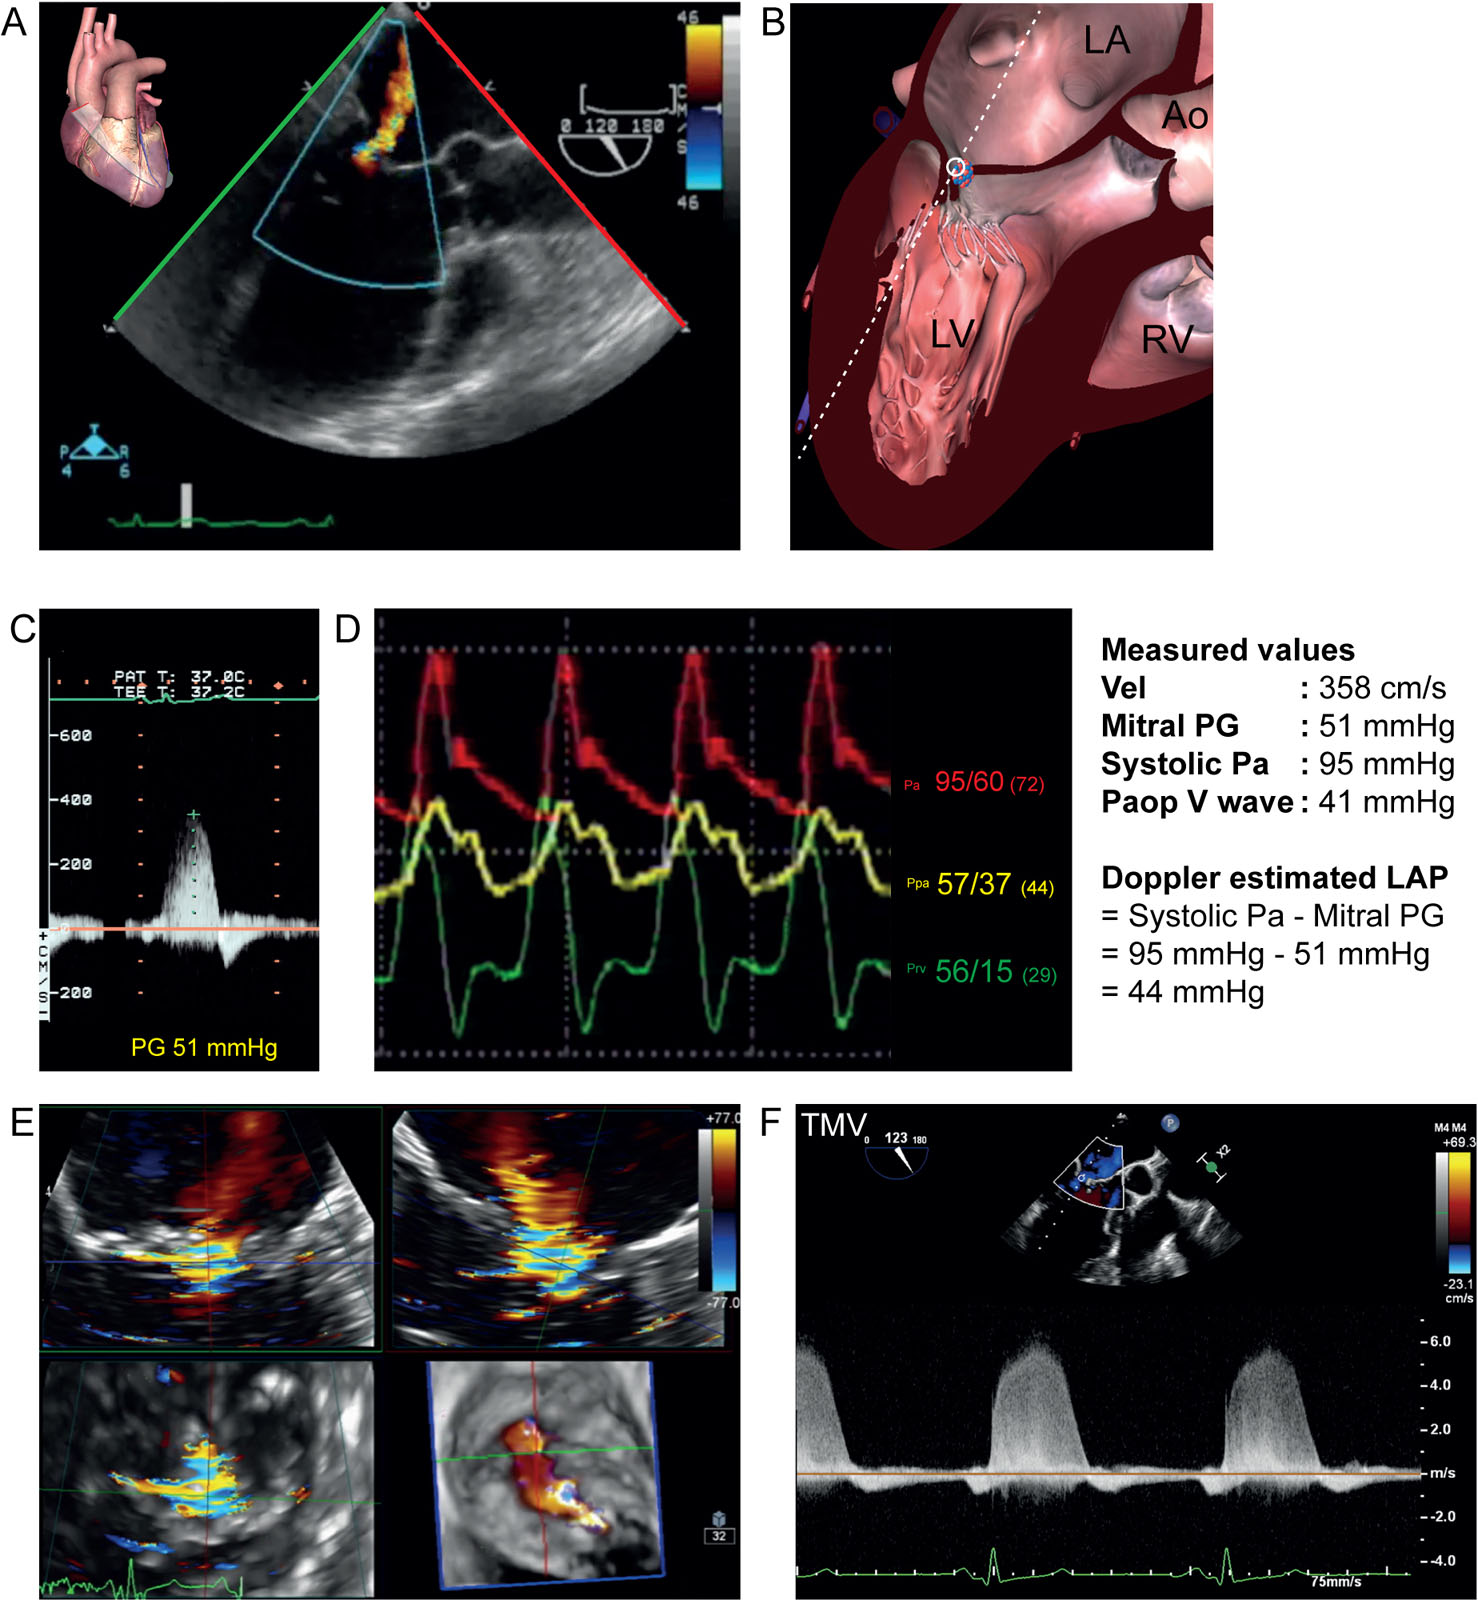
eFigure 11.40
MR in DCM. This is a 56-year-old woman with dilated ischemic cardiomyopathy prior to coronary revascularization, surgical ventricular remodeling and mitral valve repair. (A, B) The ME LAX view with CFI shows MR. (C) ME LAX view with CWD can obtain a spectral Doppler trace of MR, which can estimate the LAP. The maximal PG between the LV and LA was 51 mmHg. With a systolic Pa of 95 mmHg which is equal to the LV systolic pressure, the estimated maximal LAP is (95 mmHg – PG) and equal to 44 mmHg. (D) There was severe pulmonary hypertension with a diastolic Ppa of 37 mmHg and a “V” wave of 41 mmHg. (E, F) MPR of the MV in a 62-year-old man with DCM. Note the eccentric VCA and the dense MR signal on CWD. . Abbreviations: Ao, aorta; CFI, color flow imaging; CWD, continuous wave Doppler; DCM, dilated cardiomyopathy; LA, left atrium; LAP, left atrial pressure; LAX, long-axis; LV, left ventricle; ME, mid-esophageal; MPR, multiplane reconstruction; MR, mitral regurgitation; Pa, arterial pressure; Paop, pulmonary artery occlusion pressure; PG, pressure gradient; Ppa, pulmonary artery; Prv, right ventricular pressure; RV, right ventricle; TMV, transmitral velocity; VCA, vena contracta area; Vel, velocity.
Videos
Chapter 11 Fig03A
Chapter 11 Fig03C
Chapter 11 Fig04A
Chapter 11 Fig04C
Chapter 11 Fig05B
Chapter 11 Fig05C
Chapter 11 Fig05D
Chapter 11 Fig07CD
Chapter 11 Fig08D
Chapter 11 Fig10A
Chapter 11 Fig15AC
Chapter 11 Fig16A
Chapter 11 Fig17A
Chapter 11 Fig20A
Chapter 11 Fig20C
Chapter 11 Fig21C
Chapter 11 Fig25A
Chapter 11 Fig25B
Chapter 11 Fig25E
Chapter 11 Fig26A H
Chapter 11 Fig28A
Chapter 11 Fig29AC
Chapter 11 Fig29BE
Chapter 11 Fig33A
Chapter 11 Fig33C
Chapter 11 Fig34A
Chapter 11 Fig35C
Chapter 11 Fig35E
Chapter 11 Fig35F
Chapter 11 Fig37A
Chapter 11 Fig37C
Chapter 11 Fig37F
Chapter 11 Fig38A
Chapter 11 Fig38C
Chapter 11 Fig38E
Chapter 11 Fig39A
Chapter 11 Fig39C
Chapter 11 Fig39D
Chapter 11 Fig40A
Chapter 11 Fig40E
Chapter 11 Fig41A
Chapter 11 Fig41D
Chapter 11 Fig41G
Chapter 11 Fig41H
Chapter 11 Fig42A
Chapter 11 Fig42C
Chapter 11 Fig42E
Chapter 11 Fig43A
Tables
|
TEE View |
Icon |
View-Technique |
Utility |
1 |
 |
 |
ME 5C |
|
2 |
 |
 |
ME 4C |
|
5 |
 |
 |
ME LAX |
|
16 |
 |
 |
TG Basal SAX |
|
17 |
 |
 |
TG Mid papillary SAX |
|
18 |
 |
 |
TG Apical SAX |
|
21 |
 |
 |
DTG 5C |
|
22 |
 |
 |
TG 2C LAX |
|
|
 |
MV 3D viewed from LV |
|
|
Abbreviations: 2C, two-chamber; 2D, two-dimensional; 3D, three-dimensional; 4C, four-chamber; 5C, five-chamber; AoV, aortic valve; CFI, color flow imaging; DTG, deep transgastric; HCM, hypertrophic cardiomyopathy; IVS, interventricular septum; LAX, long-axis; LV, left ventricle; LVOT, left ventricular outflow tract; MAC, mitral annular calcification; ME, mid-esophageal; MR, mitral regurgitation; MV, mitral valve; SAM, systolic anterior motion; SAX, short-axis; TEE, transesophageal echocardiography; TG, transgastric. Adapted from Nampiaparapil and Hahn et al.33 32 |
||||