Figures
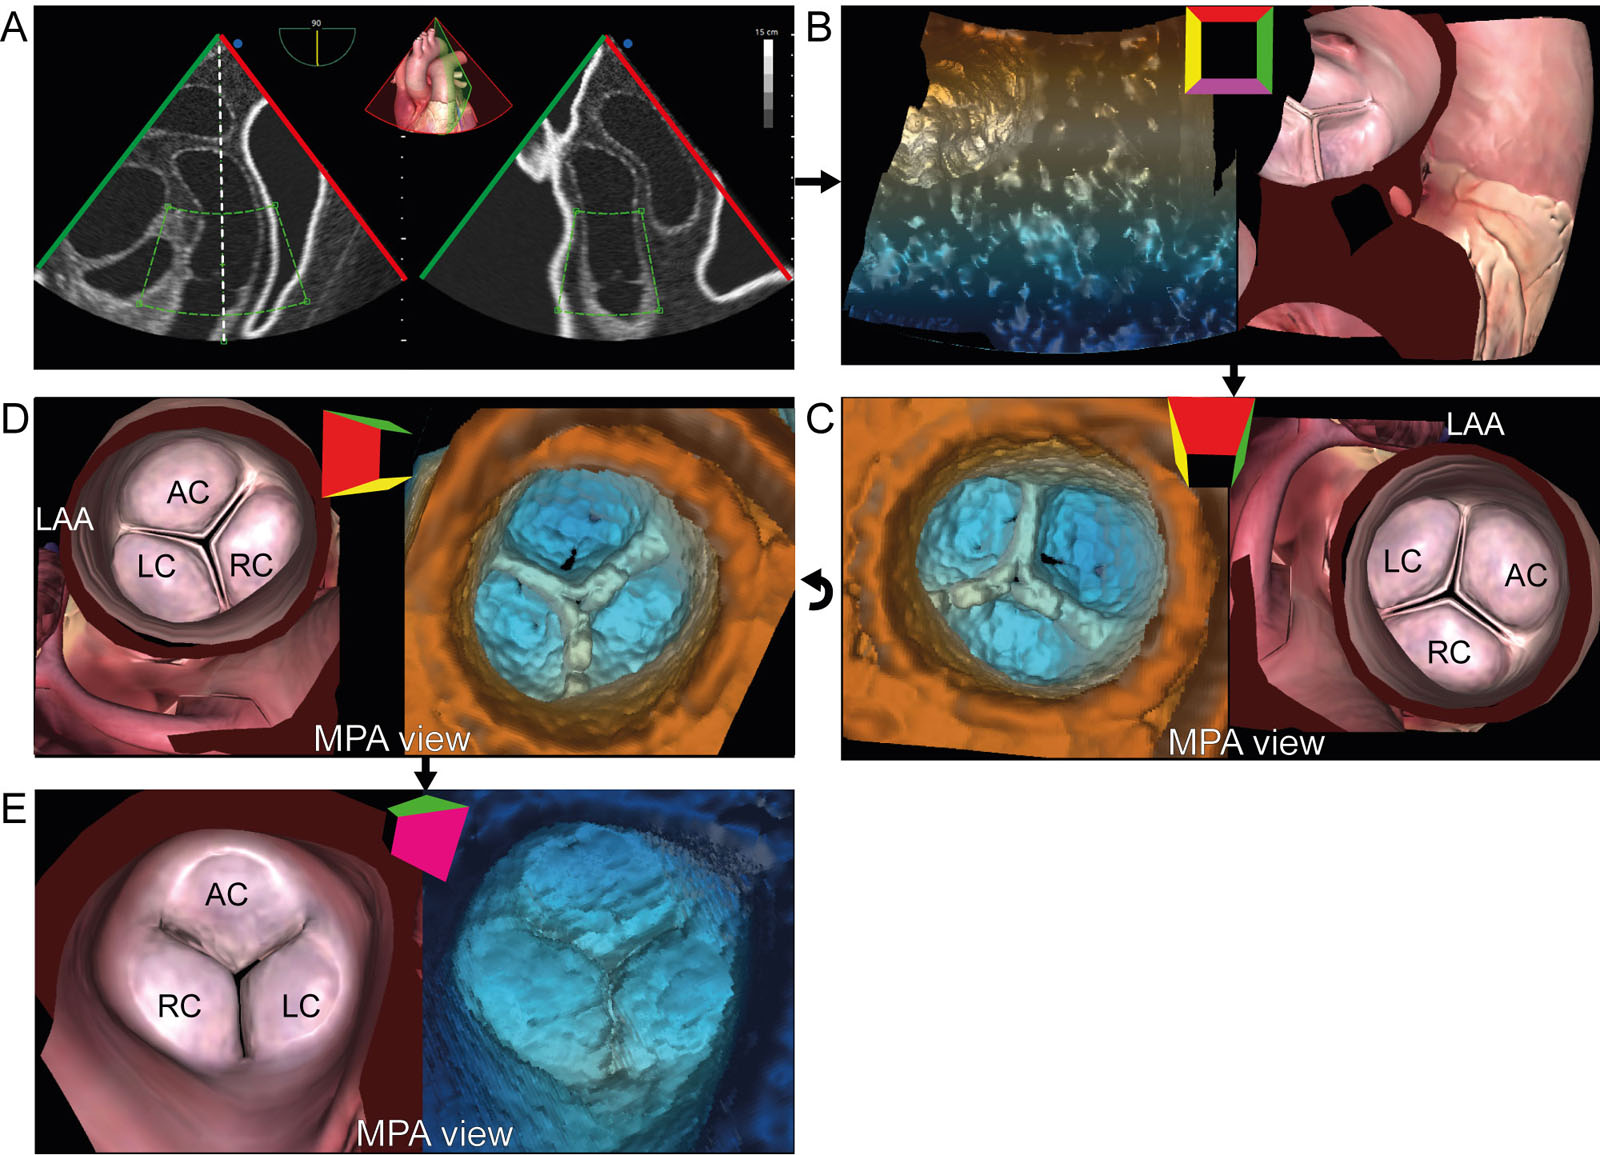
eFigure 19.7
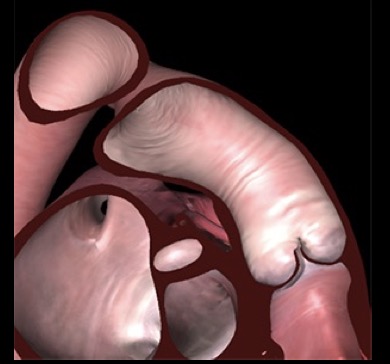
PV 3D zoom acquisition. (A) 3D zoom acquisition from an ME view should include all 3 PV cusps, and slight portions of the AoV, aorta and LAA. (B) A 3D frustrum is acquired and (C) rotated downward and (D) to the left. An MPA view of the PV is obtained. (E) Slight counterclockwise rotation leads to the recommended PV from an MPA perspective. (F) A 180° rotation allows visualization of the PV through the RV. Abbreviations: 3D, three-dimensional; AC, anterior cusp; AoV, aortic valve; LAA, left atrial appendage; LC, left cusp; ME, mid-esophageal; MPA, main pulmonary artery; PV, pulmonic valve; RC, right cusp; RV, right ventricle. Adapted from Hahn et al. 2.
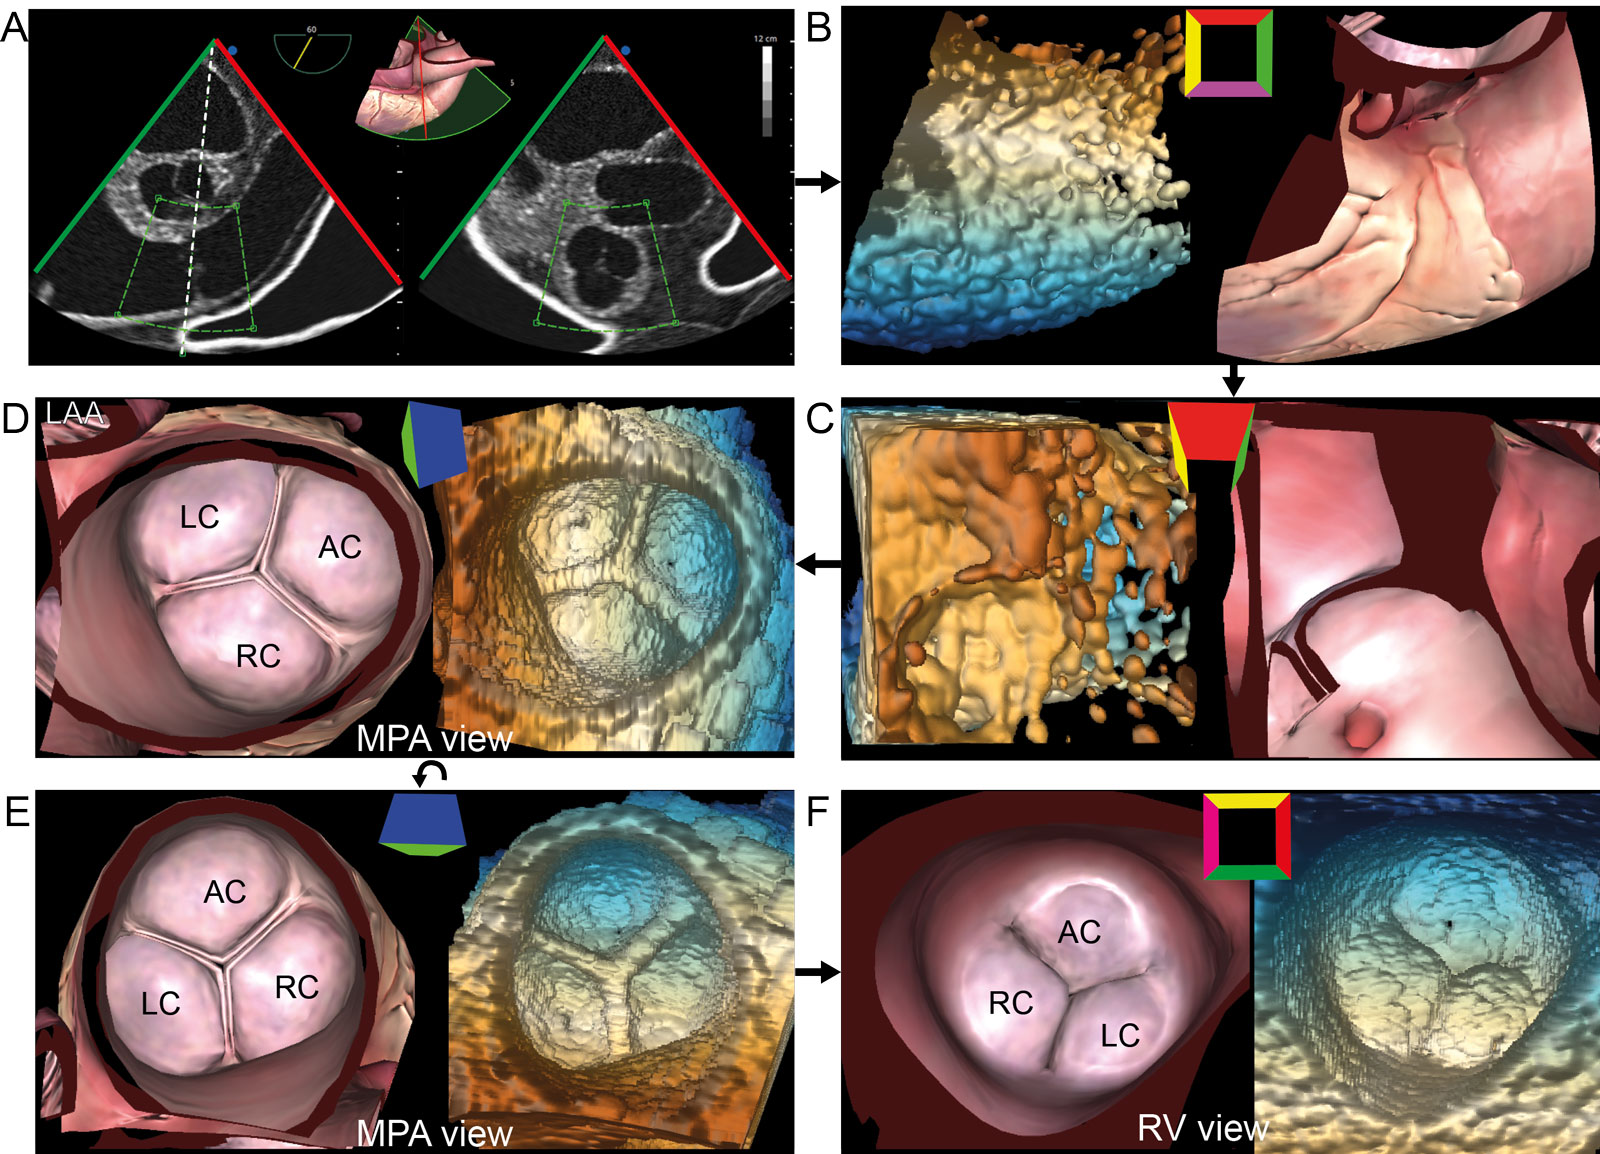
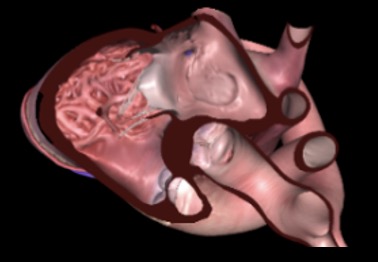
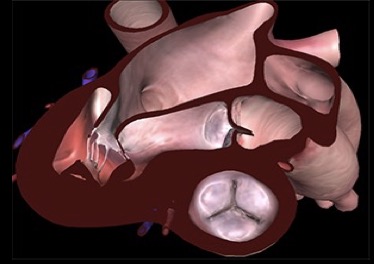
eFigure 19.8
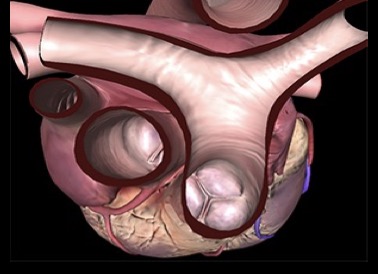
PV 3D dataset. This is the acquisition sequence using 3D zoom to obtain an en-face view of the PV from a UE Arch SAX view. (A) 3D zoom acquisition centers the PV in the acquisition box including all 3 PV cusps, and slight portions of the AoV, Ao and the LAA (B) A 3D frustrum is acquired and (C) rotated downward and (D) to the left to show the PV from a MPA perspective. (E) Counterclockwise rotation 90° leads to the recommended PV orientation with the AC at 12 o’clock from an MPA perspective. (F) A 180° rotation shows the PV from the RVOT perspective. Abbreviations: 3D, three-dimensional; AC, anterior cusp; Ao, aorta; AoV, aortic valve; LA, left atrium; LAA, left atrial appendage; LC, left cusp; MPA, main pulmonary artery; PV, pulmonic valve; RC, right cusp; RV, right ventricle; RVOT, right ventricular outflow tract; SAX, short-axis; UE, upper esophageal. Adapted from Hahn et al.2.
eFigure 19.13
Videos
Chapter 19 Fig01A
Chapter 19 Fig01B
Chapter 19 Fig02A
Chapter 19 Fig03A
Chapter 19 Fig04A
Chapter 19 Fig04B
Chapter 19 Fig04D
Chapter 19 Fig05A
Chapter 19 Fig05C
Chapter 19 Fig5D
Chapter 19 Fig06A
Chapter 19 Fig06C
Chapter 19 Fig06E
Chapter 19 Fig06F
Chapter 19 Fig07BCDE
Chapter 19 Fig09A
Chapter 19 Fig09D
Chapter 19 Fig09E
Chapter 19 Fig10A
Chapter 19 Fig10F
Chapter 19 Fig10G
Chapter 19 Fig12A
Chapter 19 Fig12C
Chapter 19 Fig12E
Chapter 19 Fig17A
Chapter 19 Fig17B
Chapter 19 Fig18A
Chapter 19 Fig18B
Chapter 19 Fig18C
Chapter 19 Fig18D
Tables
eTable 19.1 TEE views for assessing the RVOT, PV and PA
TEE View |
View-Technique |
Utility/Disadvantages |
 |
ME RV Inflow-Outflow |
|
 |
UE Aortic arch SAX |
|
 |
ME Ascending Aorta SAX |
|
 |
TG RV basal SAX |
|
 |
TG RV Inflow outflow |
|
 |
TG RV inflow |
|
 |
ME PV SAX |
|
Abbreviations: CFI, color flow imaging; CWD, continuous wave Doppler; ME, mid-esophageal; PA, pulmonary artery; PV, pulmonic valve; PWD, pulsed-wave Doppler; RV, right ventricular; RVOT, right ventricular outflow tract; RVSP, right ventricular systolic pressure; SAX, short-axis; TEE, transesophageal echocardiography; TG, transgastric; TR, tricuspid regurgitation; UE, upper esophageal. Adapted from Hahn et al. 56 |
||
eTable 19.4 Echocardiography parameters for grading PR severity
| PR severity classes | Mild | Moderate | Severe |
| Structural and qualitative parameters | |||
| RV sizea | Usually normal | Normal or dilated | Usually dilated |
| PV morphology | Normal | Moderate/abnormal | Abnormal and may not be visible |
| CFI PR jet widthb | Small < 10 mm length with narrow origin | Intermediate | Large with a wide origin May be of brief duration |
| PWD flow reversal in main PA or branches | Absent | Absent | Present |
| CWD signal of PR jetc | Faint/slow deceleration | Dense/variable | Dense/steep deceleration Early termination of diastolic flow |
| PWD pulmonic vs aortic flowd | Normal or slightly increased | Intermediate | Greatly increased |
| Semi-quantitative parameters | |||
| VC width (mm) | Not defined | ||
| PWD DT of PR (ms) | Not defined | < 260 | |
| CWD PHT (ms)e | < 100 | ||
| PR jet width/PV annulus ratio (%)f | > 65 | ||
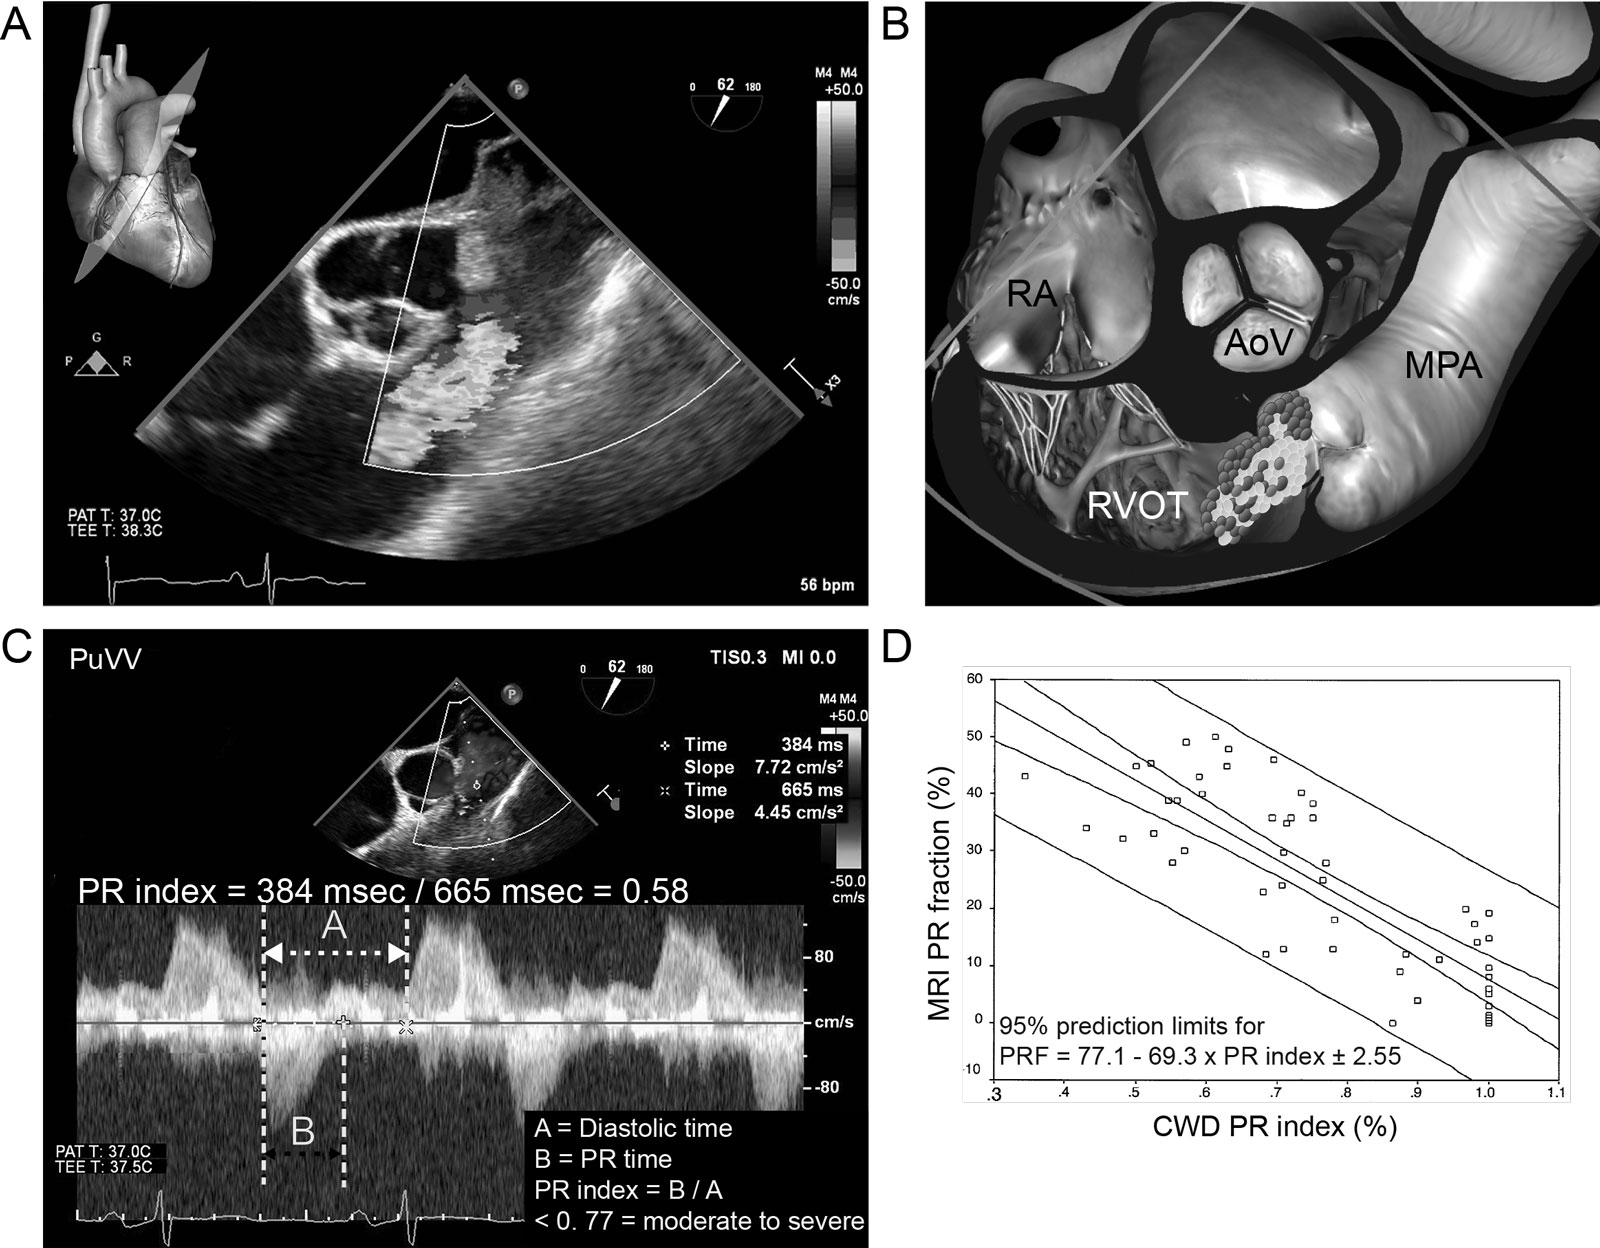
| PR indexg | < 0.77 | ||
| Quantitative Parameters | |||
| EROAR (cm²) | Not defined | ||
| RVol (ml) | |||
| RF (%)h | < 20 | 20-40 | > 40 |
| Other modalities | |||
| CMR RF (%) | < 20 | 20-40 | > 40 |
| a In the absence of other causes of increased RV size. Unless for other reasons, the RV size is usually normal in patients with mild PR. In acute severe PR, the RV size is often normal. Accepted cut-off values for non-significant right-sided chambers enlargement (measurements obtained from the ME 4C): mild RV dimension ≤ 33 mm, RVEDA ≤ 28 cm², RVESA ≤ 16 cm², RVFAC >32%. b At a Nyquist limit of 50 to 70 cm/s. c Steep deceleration is not specific for severe PR. d Pulmonic systolic VTI compared to LVOT VTI using PWD. The cutoff values for RVol and RF are not well validated. e PHT shortens and is not reliable with increasing RVEDP. f Identifies a CMR-derived PR fraction ≥40%. g PR index: defined as the duration of the CWD PR signal divided by the total duration of diastole, with this cutoff identifying a CMR-derived PR fraction > 25%. h RF data primarily derived from CMR with limited application in echocardiography. Calculate using VTI: RVol = SV RVOT -SV LVOT; RF = RVol/SV RVOT. | |||
| Abbreviations: 4C, four-chamber; CFI, color flow imaging; CMR, cardiac magnetic resonance; CWD, continuous wave Doppler; DT, deceleration time; EROAPR, PR effective regurgitant orifice area; LVOT, left ventricular outflow tract; ME, mid-esophageal; PA, pulmonary artery; PHT, pressure half-time; PR, pulmonary regurgitation; PV, pulmonic valve; PWD, pulsed wave Doppler; RF, regurgitant fraction; RV, right ventricle; RVEDA, right ventricular end-diastolic area; RVEDP, right ventricular end-diastolic pressure; RVESA, right ventricular end-systolic area; RVFAC, right ventricular fractional area change; RVol, regurgitant volume; RVOT, right ventricular outflow tract; SV, stroke volume; VC, vena contracta; VTI, velocity integral. Adapted from Zoghbi17 and Lancelotti et al.21 | |||