Figures
eFigure 2.13
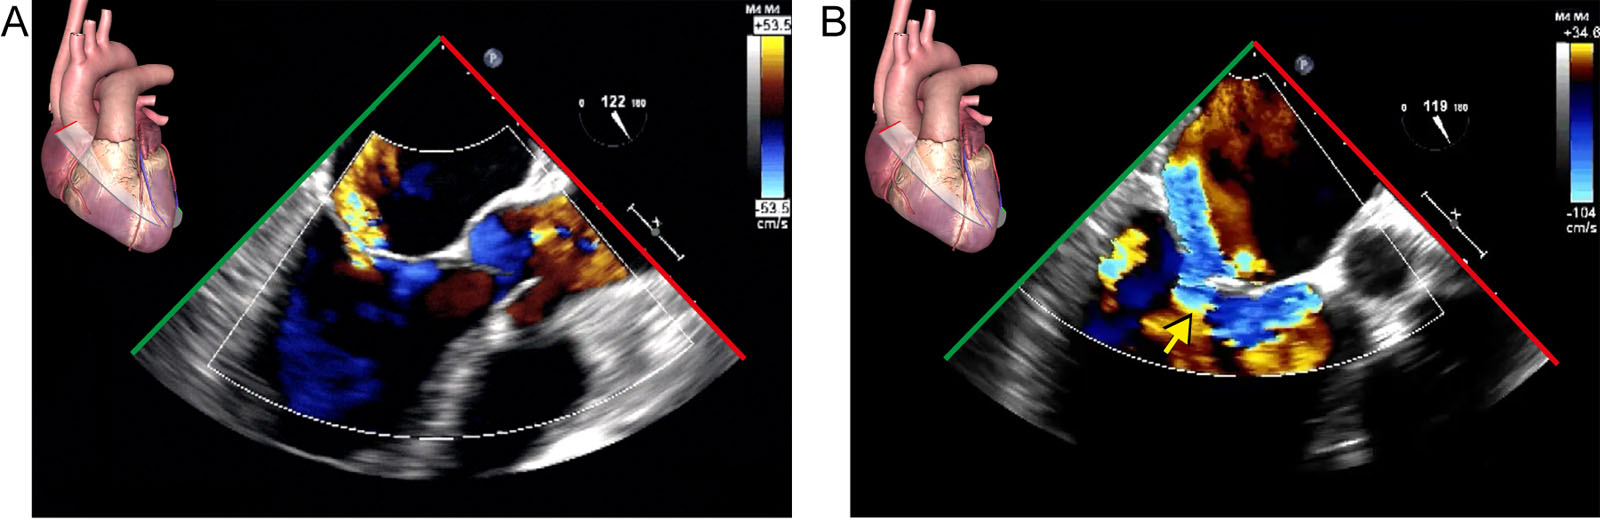
Adjusting Nyquist limit. The example shows the clinical usefulness of adjusting the Nyquist limit of the color scale in evaluating valvular regurgitation. (A) ME LAX view with CFI at a color scale of 53.5 cm/s in a patient with MR. (B) Shifting the baseline color scale to 34 cm/s and 104 cm/s changes the velocity signal. The proximal side of the MR jet has a hemispheric area of isovelocity (arrow), called the PISA. Measuring the PISA radius and deriving the effective regurgitant orifice area and the regurgitant volume can help quantify the MR severity. The size of the PISA radius is directly proportional to the aliasing speed and the Nyquist limit. Abbreviations: CFI, color-flow imaging; LAX, long-axis; ME, mid-esophageal; MR, mitral regurgitation; PISA, proximal isovelocity surface area.
eFigure 2.13Adjusting Nyquist limit. The example shows the clinical usefulness of adjusting the Nyquist limit of the color scale in evaluating valvular regurgitation. (A) ME LAX view with CFI at a color scale of 53.5 cm/s in a patient with MR. (B) Shifting the baseline color scale to 34 cm/s and 104 cm/s changes the velocity signal. The proximal side of the MR jet has a hemispheric area of isovelocity (arrow), called the PISA. Measuring the PISA radius and deriving the effective regurgitant orifice area and the regurgitant volume can help quantify the MR severity. The size of the PISA radius is directly proportional to the aliasing speed and the Nyquist limit. Abbreviations: CFI, color-flow imaging; LAX, long-axis; ME, mid-esophageal; MR, mitral regurgitation; PISA, proximal isovelocity surface area.
eFigure 2.15
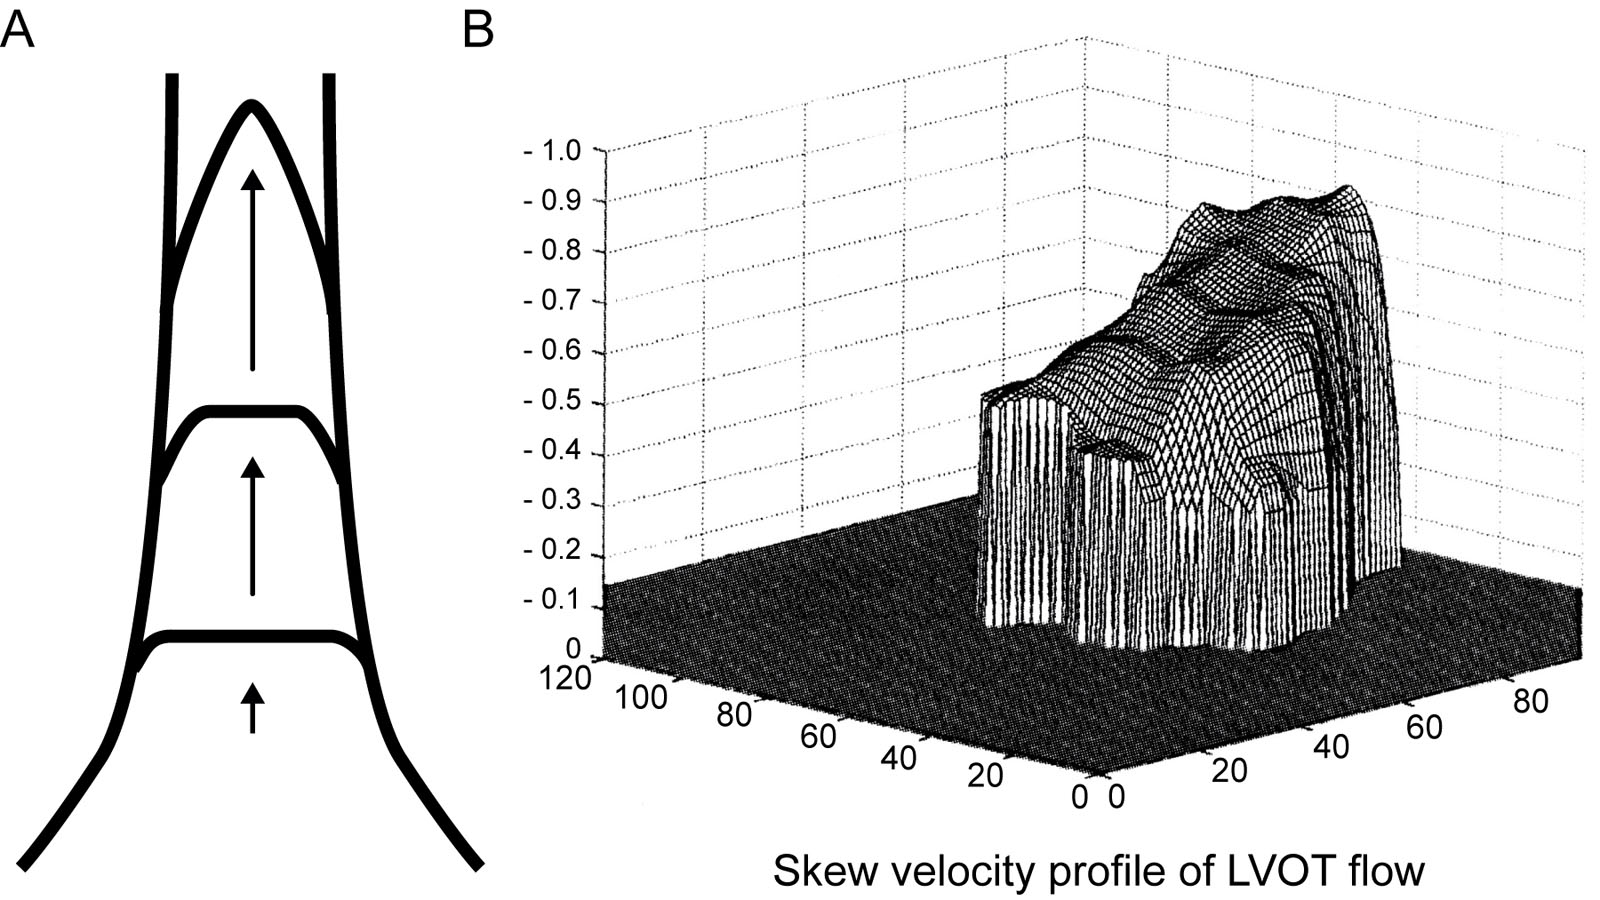
Flow profiles. (A) In a vessel, the flow front is convergent with increasing central acceleration representing a parabolic profile. (B) The 3D aspect of the systolic flow in the LVOT, the flow front is complex and skewed with an increasing speed near the septum. Abbreviation: 3D, three-dimensional; LVOT, left ventricular outflow tract. Source: With permission from Berg et al.8
eFigure 2.15Flow profiles. (A) In a vessel, the flow front is convergent with increasing central acceleration representing a parabolic profile. (B) The 3D aspect of the systolic flow in the LVOT, the flow front is complex and skewed with an increasing speed near the septum. Abbreviation: 3D, three-dimensional; LVOT, left ventricular outflow tract. Source: With permission from Berg et al.8
eFigure 2.23
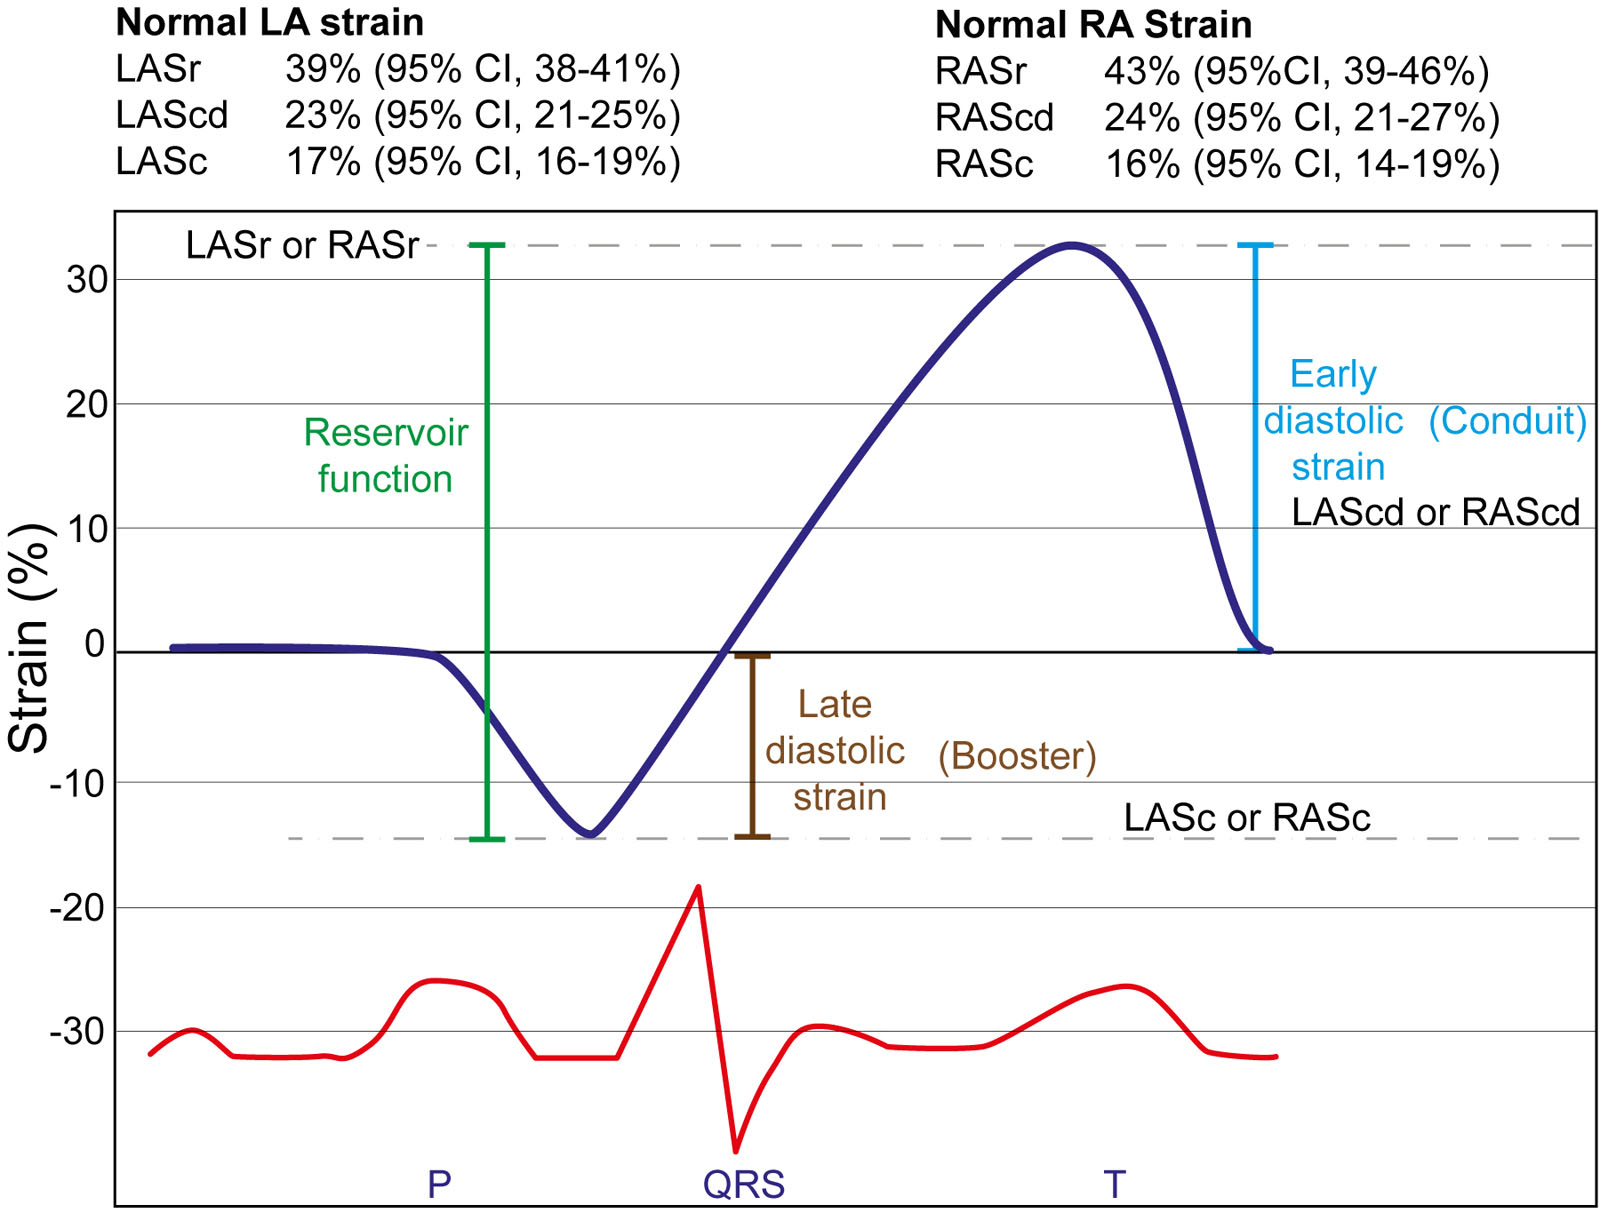
Atrial strain. There are three mechanical phases that modulate ventricular filling: the reservoir, the passive filling and the active filling. First, measurement of left atrial (LA) or right atrial (RA) peak atrial longitudinal strain reservoir (LASr or RASr) at the end of the reservoir phase before mitral valve opening. Second, the early LA or RA passive diastolic or conduit strain (LAScd or RAScd) and third, the late LA or RA active filling or peak atrial contraction strain (LASc or RASc) before the start of atrial systole. Normal LA and RA strain absolute values are shown. Adapted from Costescu et al. 47
eFigure 2.23Atrial strain. There are three mechanical phases that modulate ventricular filling: the reservoir, the passive filling and the active filling. First, measurement of left atrial (LA) or right atrial (RA) peak atrial longitudinal strain reservoir (LASr or RASr) at the end of the reservoir phase before mitral valve opening. Second, the early LA or RA passive diastolic or conduit strain (LAScd or RAScd) and third, the late LA or RA active filling or peak atrial contraction strain (LASc or RASc) before the start of atrial systole. Normal LA and RA strain absolute values are shown. Adapted from Costescu et al. 47