Figures
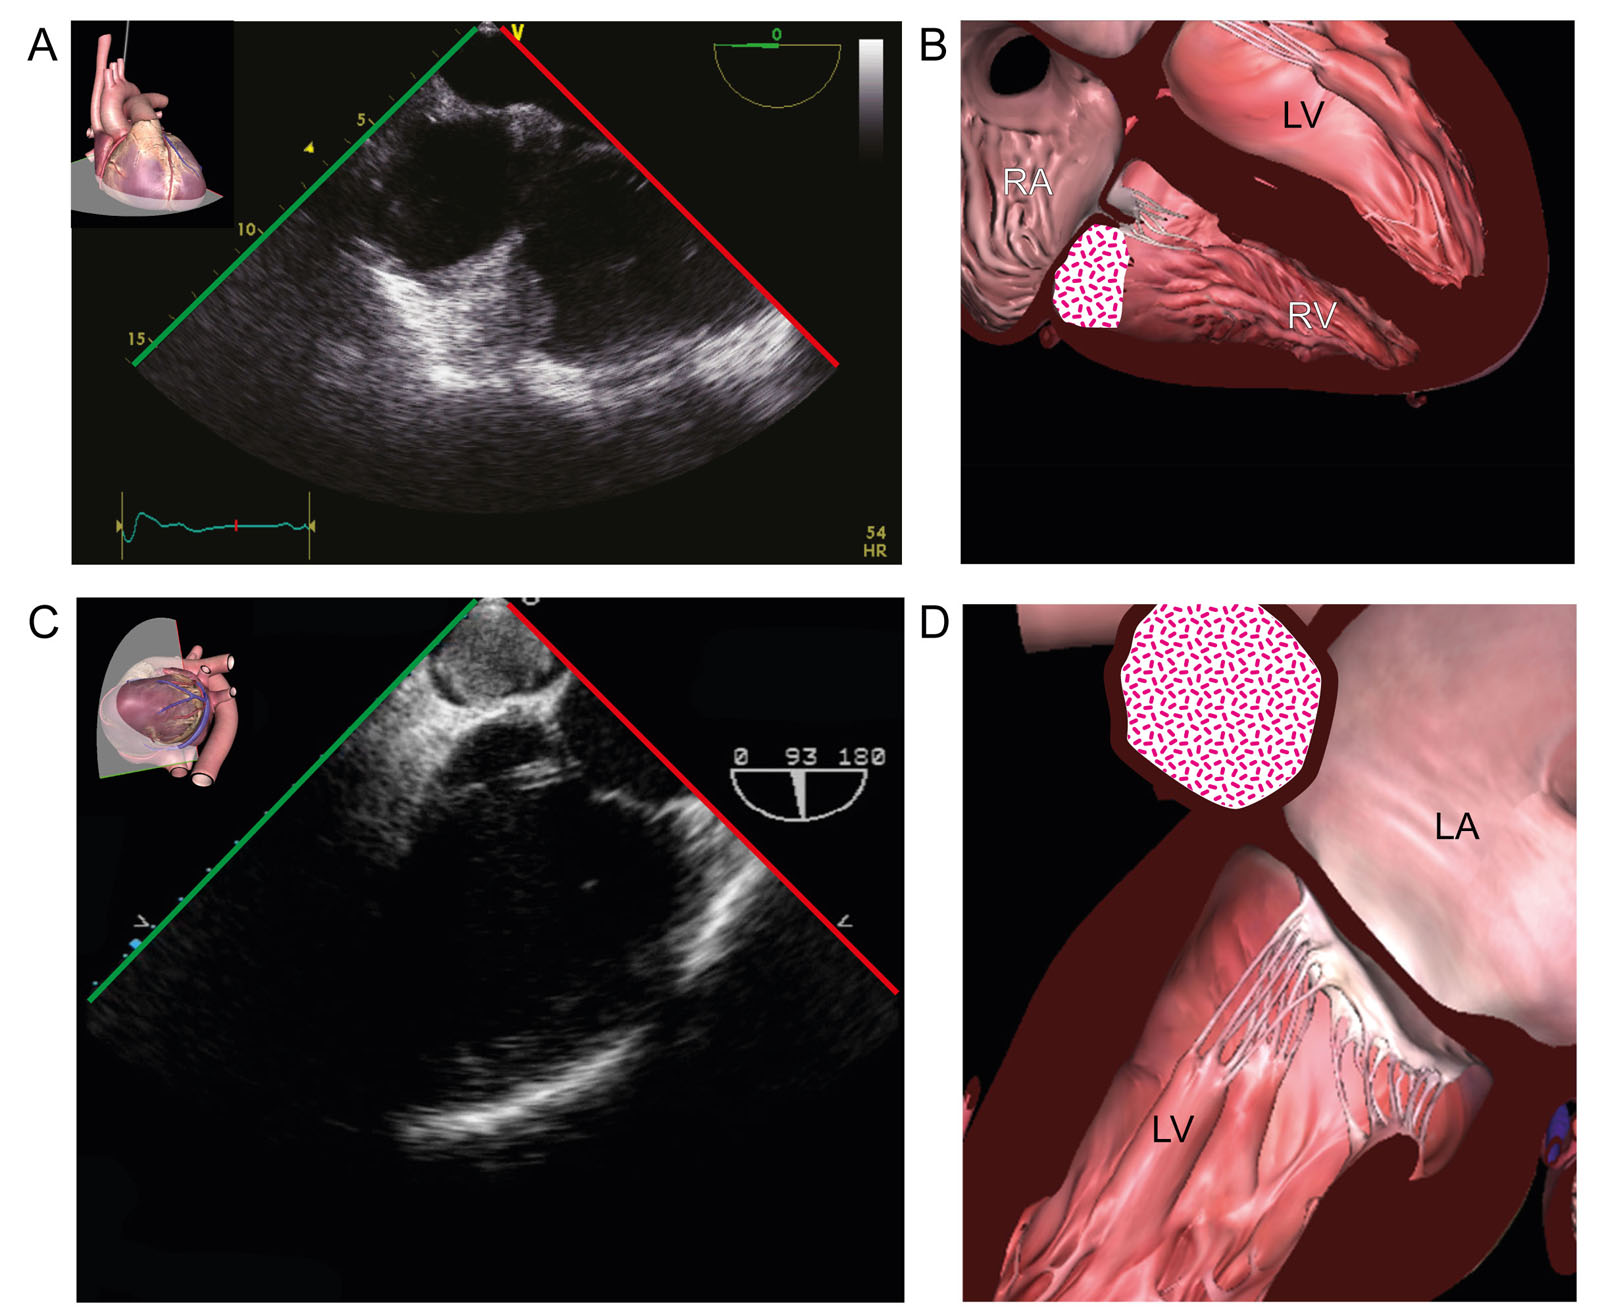
eFigure 22.4
Thrombus prior to OHT. (A, B) ME RV view at 148° and (C, D) an RV focused ME 4C (C, D) show a laminated thrombus in the RV under the TVAL in a 49-year-old woman prior to OHT. (E, F) Coronary sinus thrombus (arrow) prior to OHT. Abbreviations: 4C, four-chamber; LA, left atrium; LV, left ventricle; ME, mid-esophageal; OHT, orthotopic heart transplantation; RA, right atrium; RV, right ventricle; TVAL, tricuspid valve anterior leaflet.
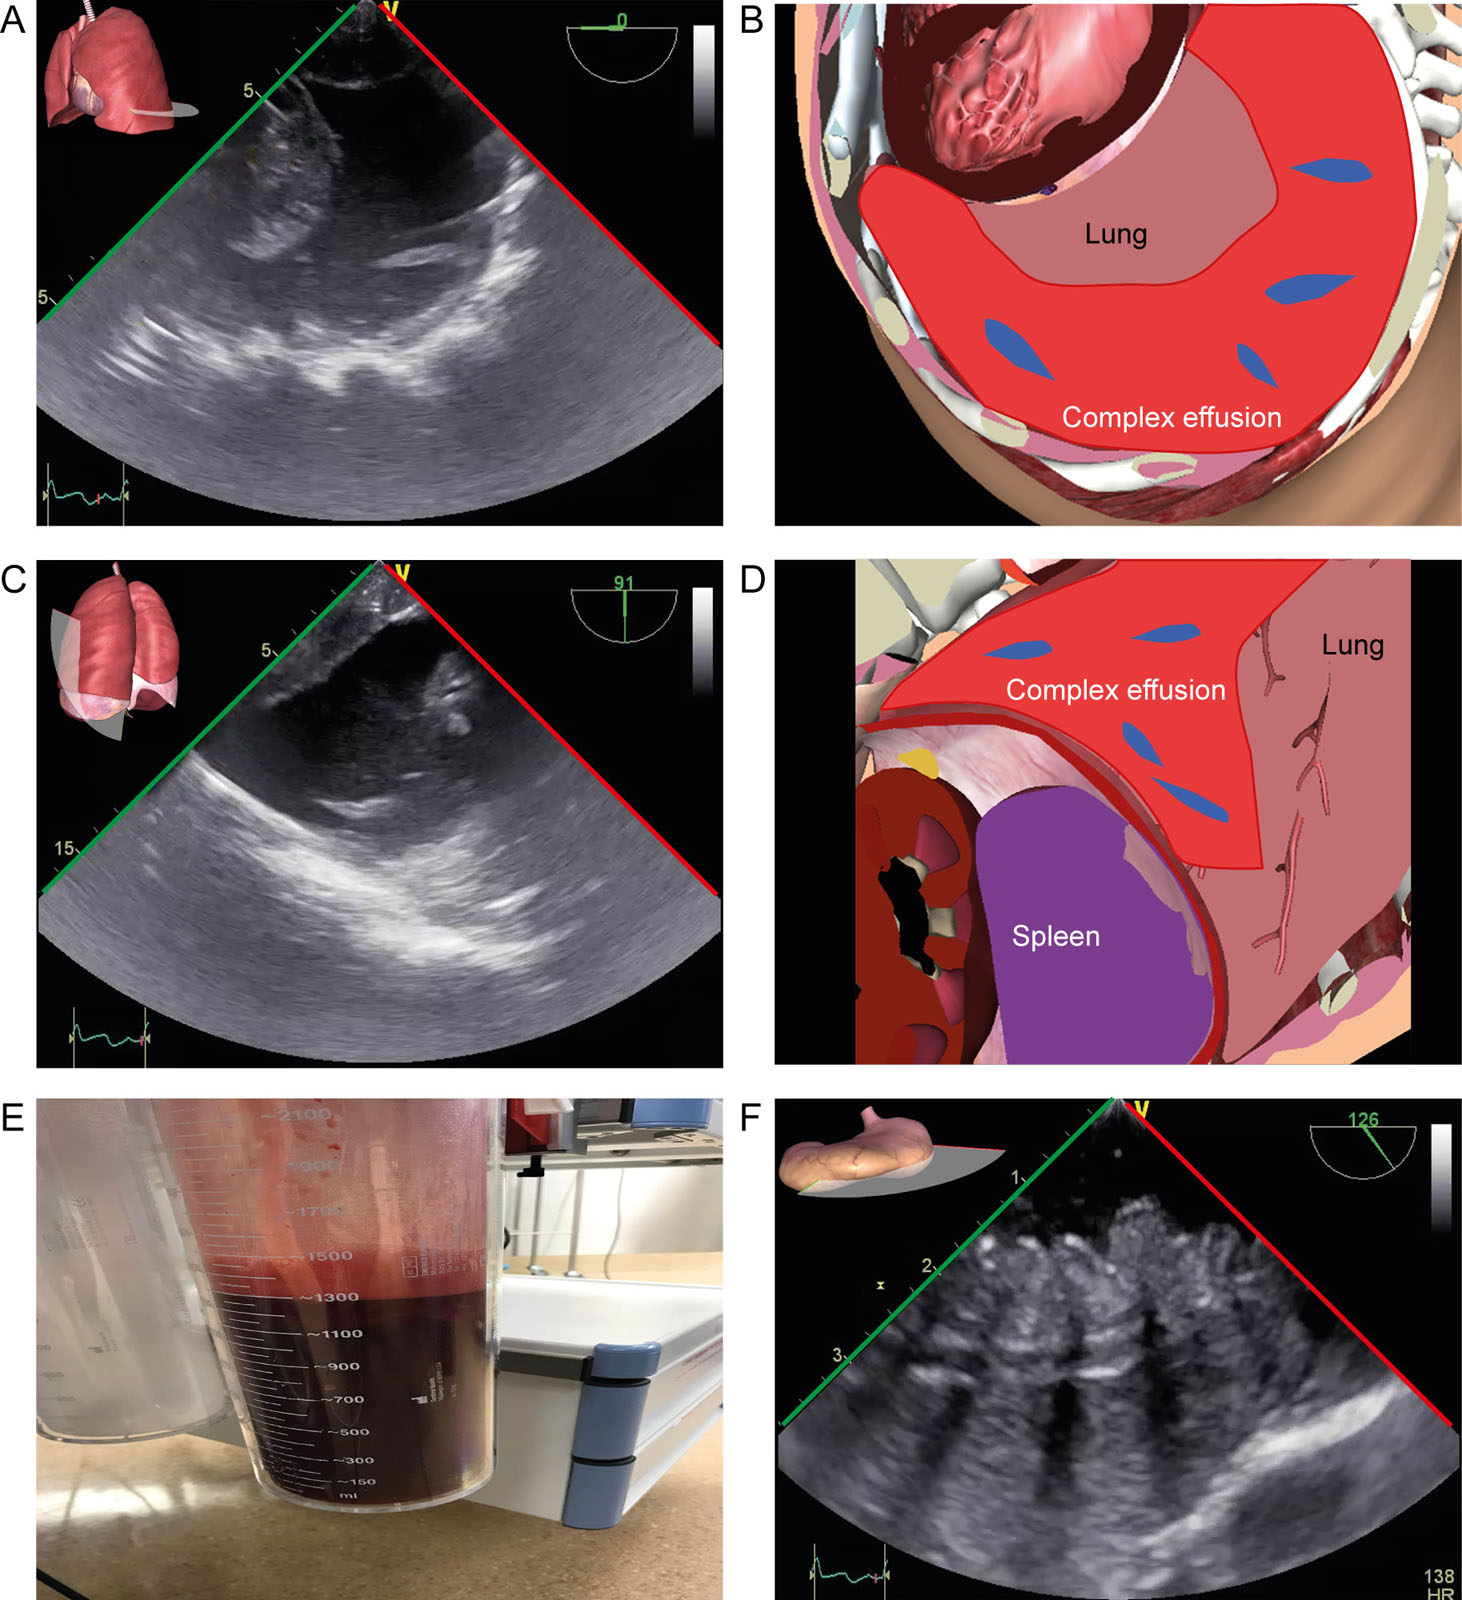
eFigure 22.5
Complex effusion before OHT. (A-D) TELUS at the base of the left lung at 0° and 91° show a 1300ml complex effusion with fibrin. (E) which was removed prior to OHT. (F) There was also severe stomach wall edema. Abbreviations: OHT, orthotopic heart transplantation; TELUS, transesophageal lung ultrasound.
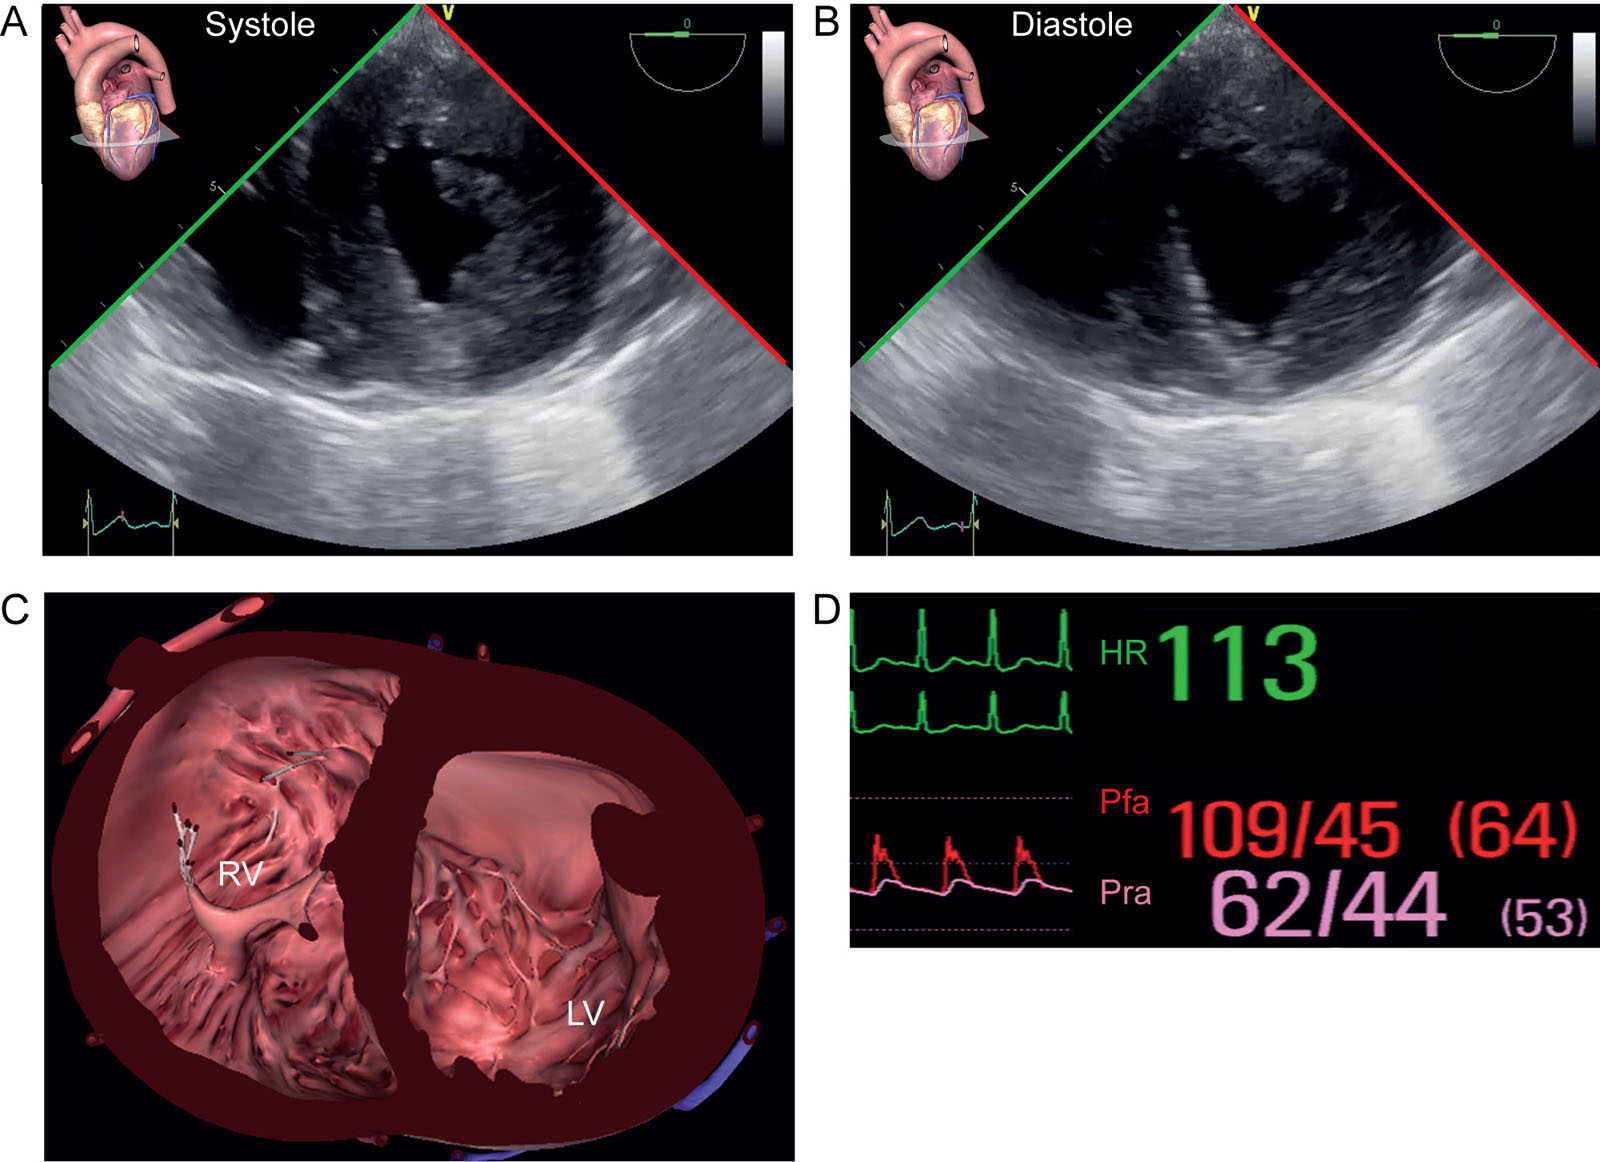
eFigure 22.12
LV function post OHT. (A-C) TG mid-papillary SAX views in systole and diastole after OHT show abnormal LV septal motion with a D-shaped septum in diastole. (D) Note the significant systolic arterial pressure gradient between the Pra and Pfa. Abbreviations: HR, heart rate; LV, left ventricle; ME, mid-esophageal; OHT, orthotopic heart transplantation; Pfa, femoral arterial pressure; Pra, radial arterial pressure; RV, right ventricle; SAX, short-axis; TG, transgastric.
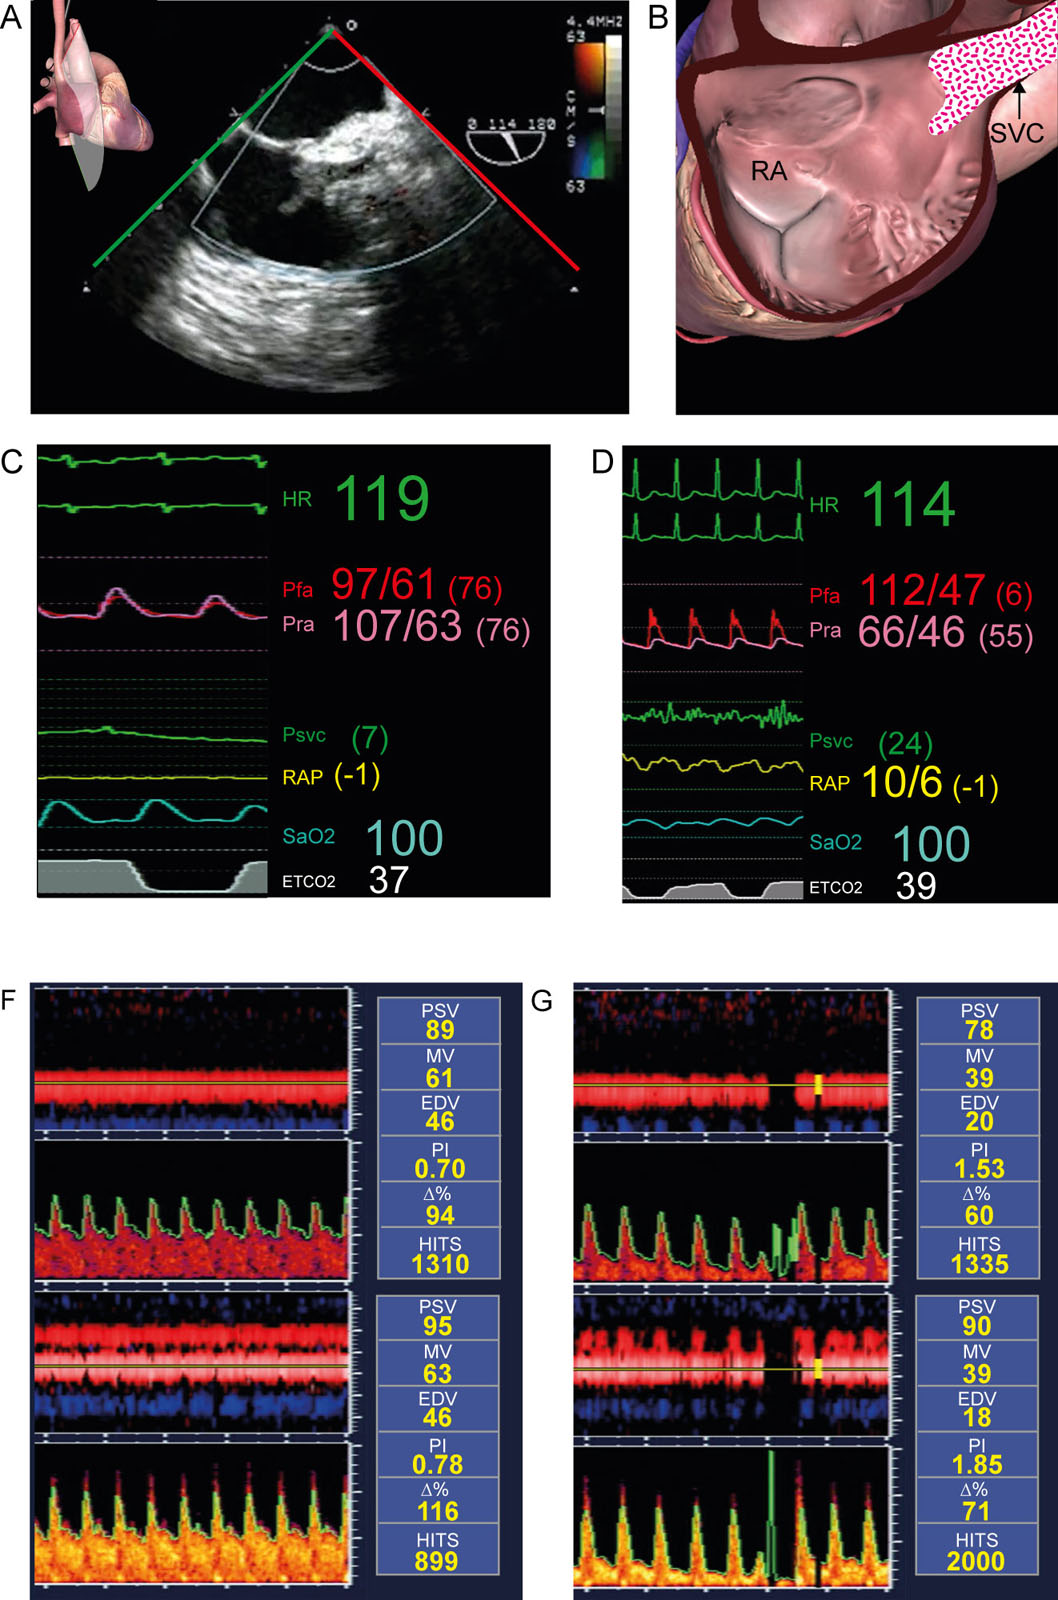
eFigure 22.16
SVC thrombus after OHT. (A-C) ME bicaval view shows an SVC thrombus. (D, E) Hemodynamic parameters before and after OHT show the mean RAP in the SVC was 7 mmHg but increased to 24 mmHg and there was a significant new Pfa (112 mmHg) to Pra (66 mmHg) gradient. (F, G) TCD shows an increase in the PI consistent with elevated cerebral venous pressure. Abbreviations: D%, delta or change compared to baseline MV; EDV, end-diastolic velocity; ETCO2, end-tidal carbon dioxide; HITS, high-intensity transient signals; HR, heart rate; ME, mid-esophageal; MV, mean velocity; OHT, orthotopic heart transplantation; Pfa, femoral arterial pressure; PI, pulsatility index; Pra, radial arterial pressure; PSV, peak systolic velocity; Psvc, pressure at SVC entrance; RA, right atrium; RAP, right atrial pressure; SaO2, arterial oxygen saturation; SVC, superior vena cava; TCD, transcranial Doppler.