Figures

eFigure 35.1
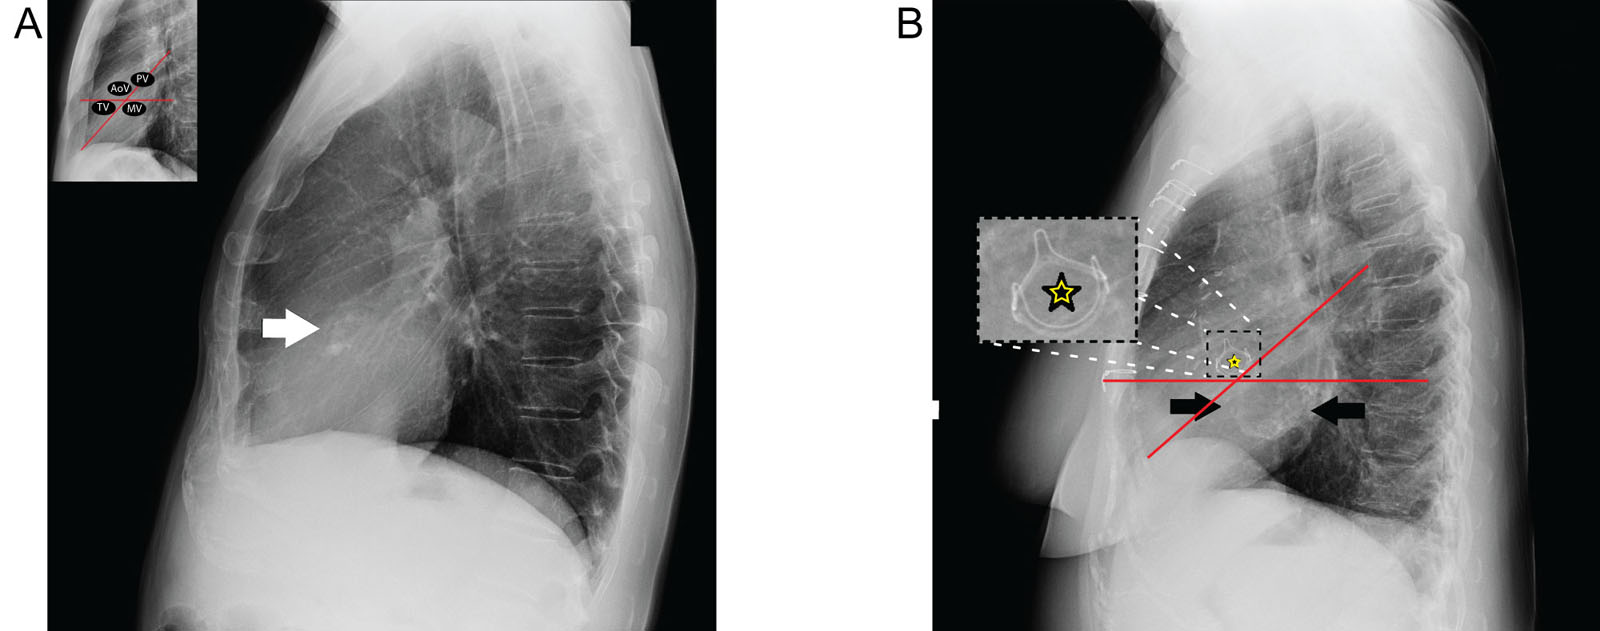
Heart borders on CXRs. (A, B) A normal CXR demonstrates the different heart borders on the (A) frontal and (B) lateral views. The curvature of the LAA is not visible unless there is dilatation of the LAA and/or the LA. (C, D) These CXRs show the locations of the heart valve location. A frontal film with imaginary lines (red lines) drawn vertically at the sternum and perpendicularly through the midpoint of the heart shows the estimated location of each valve. A lateral film with an imaginary line (red line) drawn from the cardiac apex to the carina and a second line (red line) perpendicular to the sternum through the midpoint of the heart shows the estimated location of each valve. Abbreviations: AoV, aortic valve; CXR, chest X-ray; LA, left atrium; LAA, left atrial appendage; MV, mitral valve; PV, pulmonic valve; TV, tricuspid valve.
eFigure 35.2
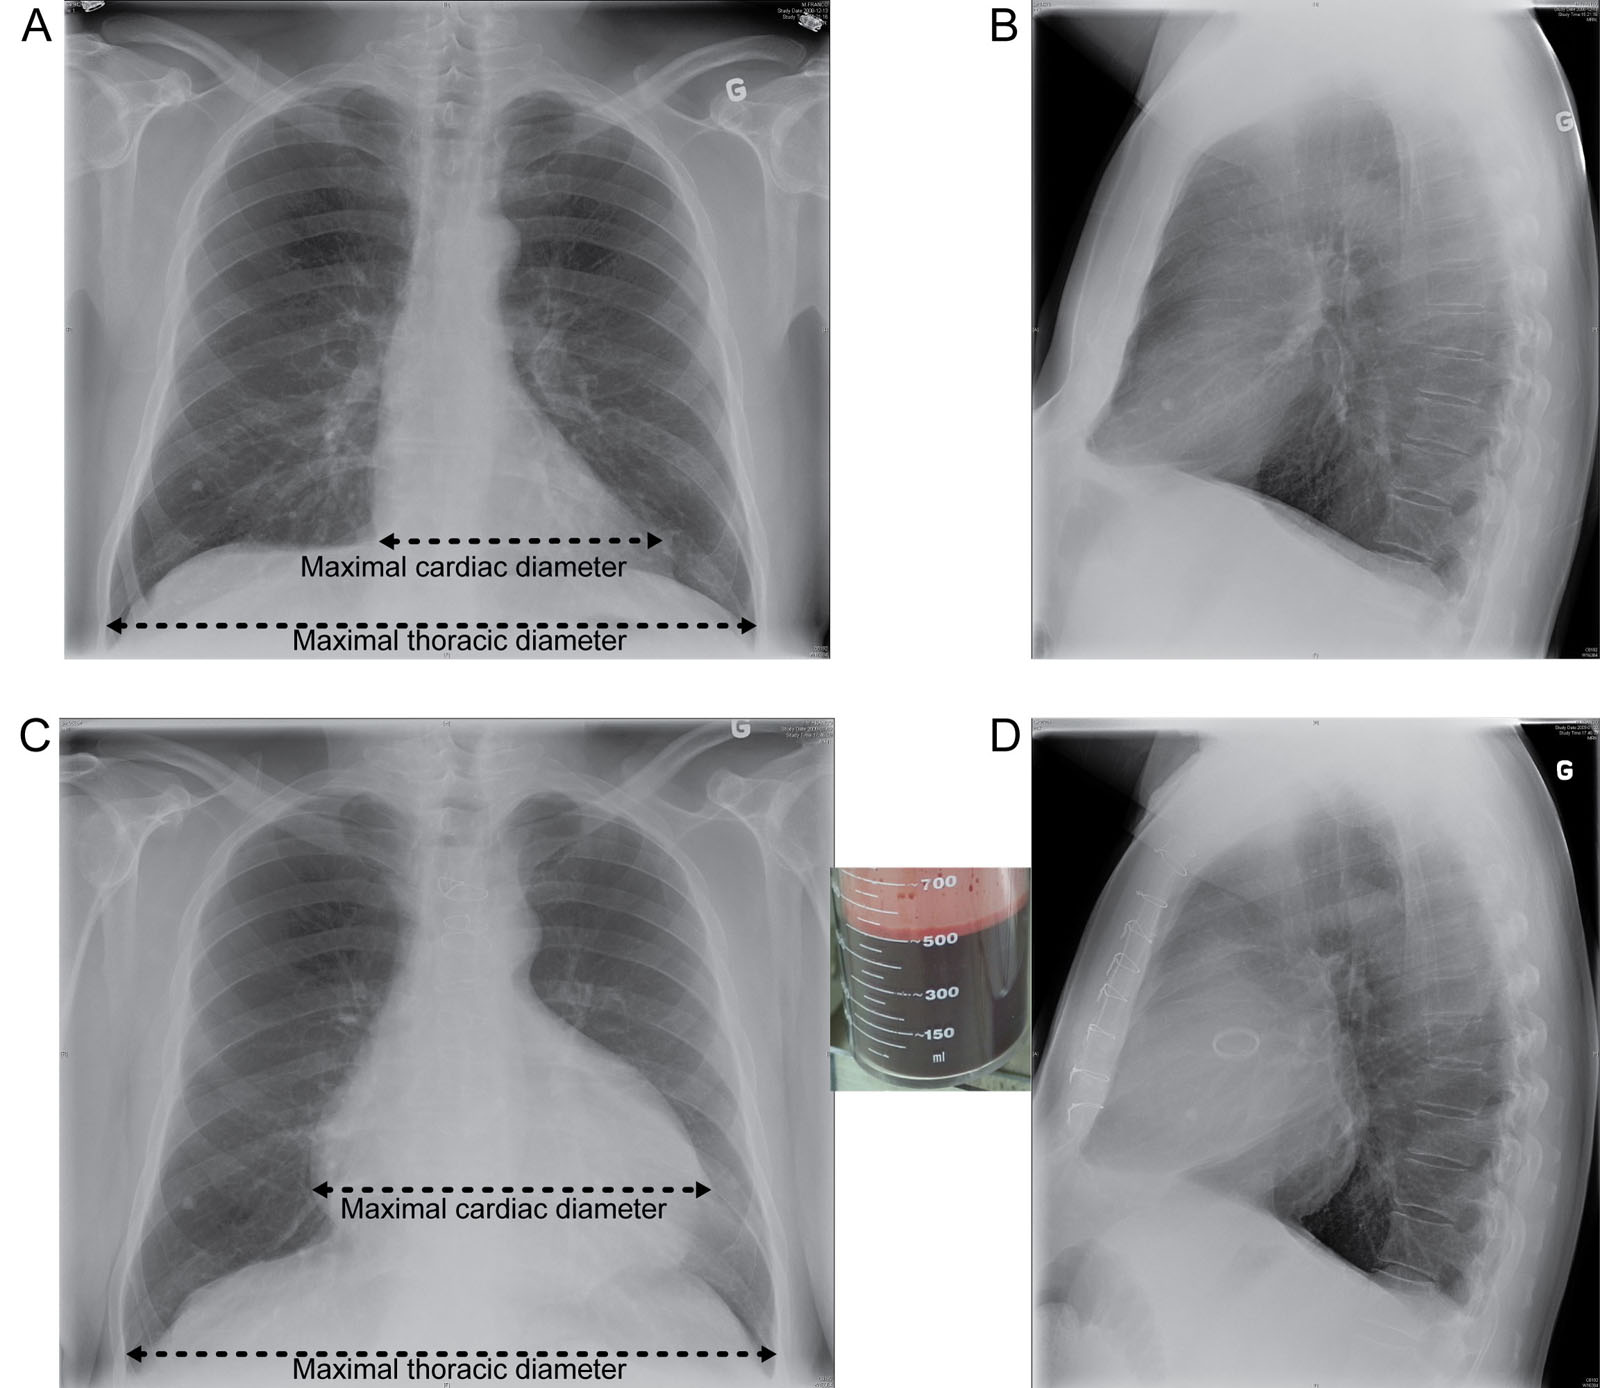
Cardiothoracic ratio. This is a 66-year-old male before AVR. (A, B) Frontal and lateral CXRs depict a normal cardiothoracic ratio of less than 0.5, as calculated from the ratio of the maximal cardiac diameter (top black line) to the maximal thoracic diameter (bottom black line). (C, D) Postoperative tamponade is present with an increased cardiothoracic ratio in both the frontal and lateral chest radiographs. There was a removal of 500 mL of pericardial fluid. Abbreviation: AVR, aortic valve replacement; CXR, chest X-ray.
eFigure 35.3
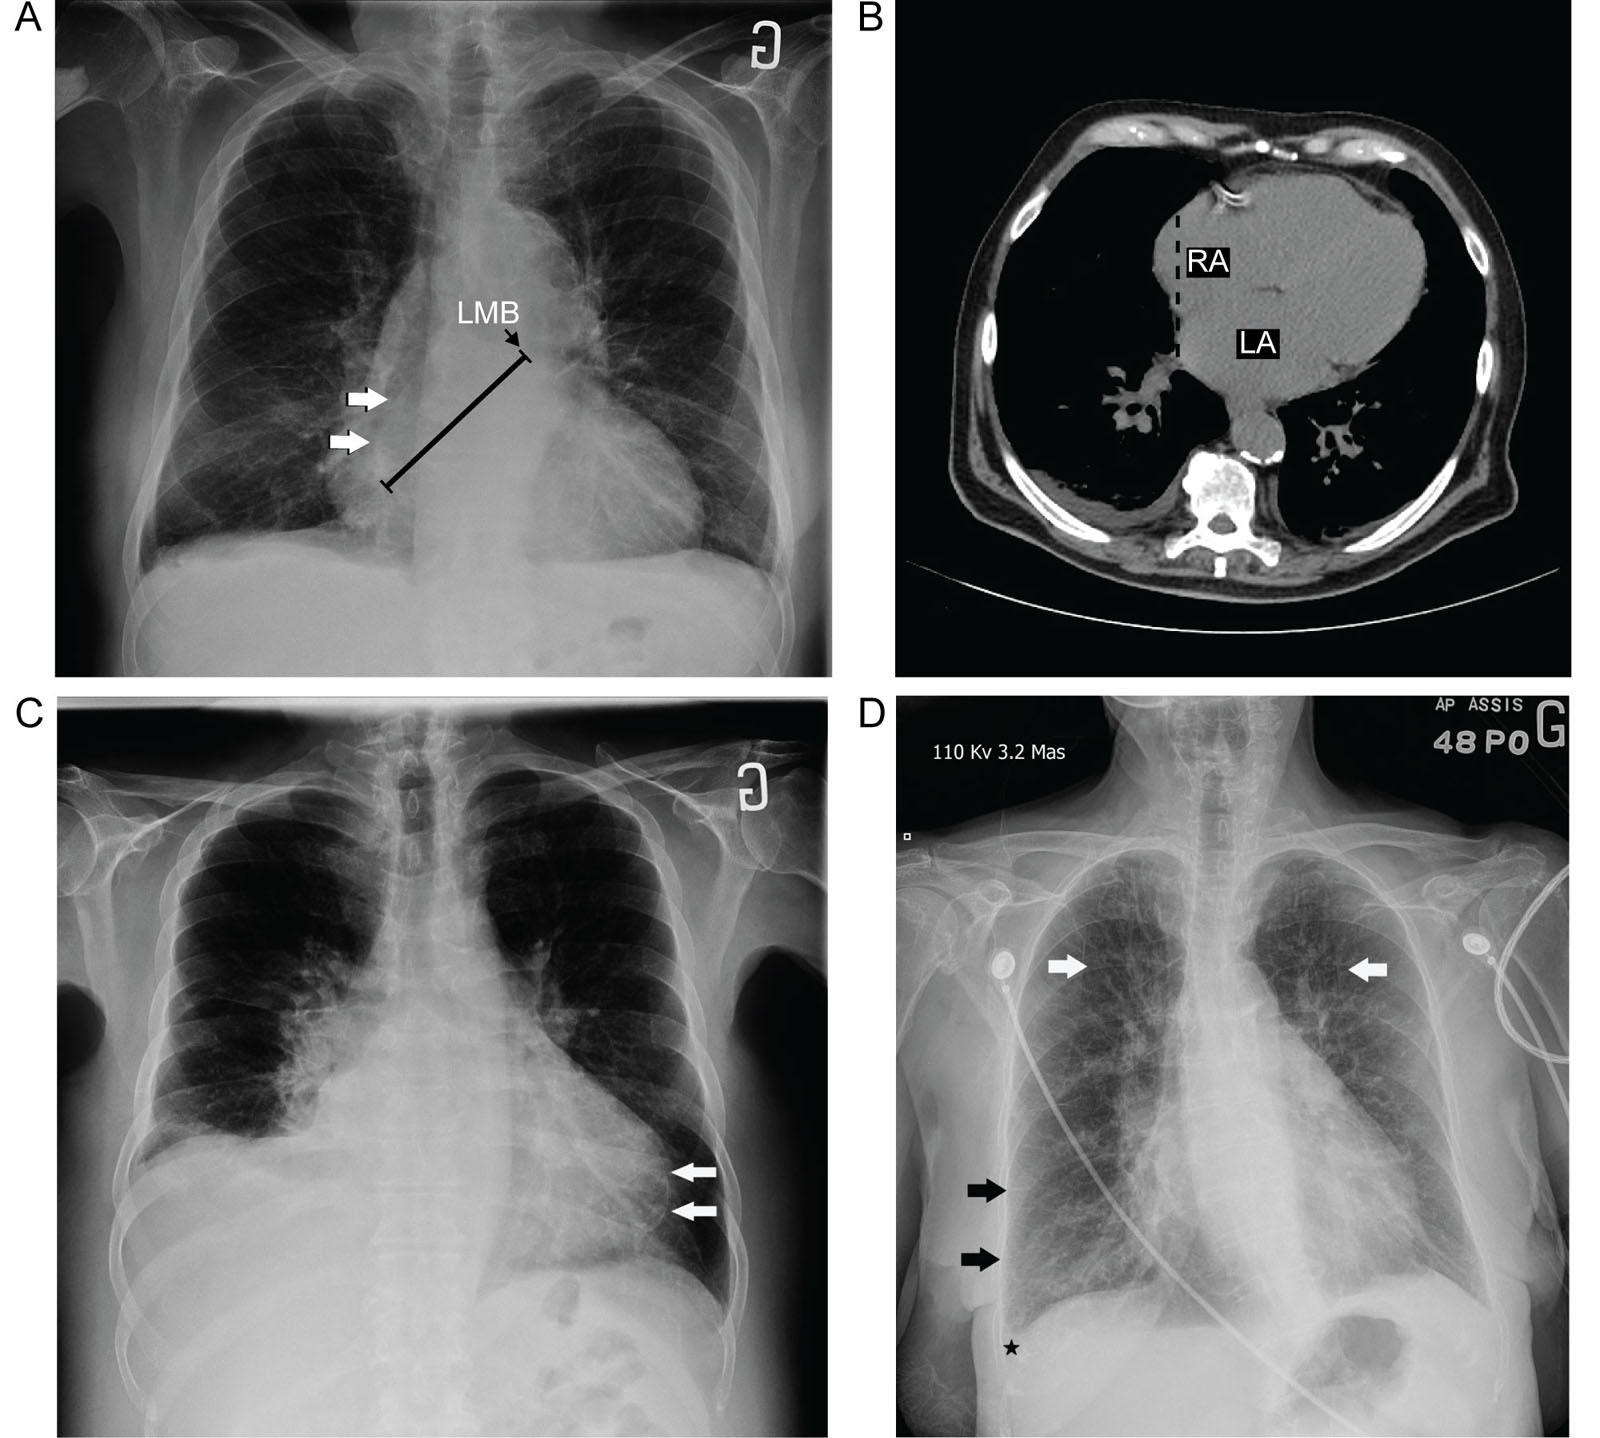
Abnormal CXR. (A, B) These examples of CXRs show enlargement of the heart chambers. (A) Frontal CXR with LA enlargement depicts the double density sign, where the right border of an enlarged LA (arrows) appears near the normal right heart border. A measurement taken from the right lateral border of the LA to the inferior border of the left main bronchus (black line) is > 7 cm, suggesting LA enlargement. (B) Unenhanced axial CT image of the same patient shows the right border of the enlarged LA displaced towards the right, creating a second density (dashed black lines) behind the RA. (C) A frontal CXR of a patient with previous infarction shows myocardial calcifications of the LV (arrows) within the heart silhouette and a small right pleural effusion. (D) Frontal CXR of a patient with cardiomegaly depicts apical redistribution of pulmonary vasculature (white arrows), thickened interlobular septa (black arrows), and a small right pleural effusion (black star), all signs indicating pulmonary edema. Abbreviations: CT, computed tomography; CXR, chest X-ray; LA, left atrium; LMB, left main bronchus; LV, left ventricle; RA, right atrium.
eFigure 35.4
Valve calcifications. (A) A lateral CXR of a 55-year-old male with severe AoV stenosis requiring valve replacement surgery depicts important aortic calcifications (arrow). (B) A lateral CXR of a 74-year-old female with a previous AoV replacement (star) shows MV annulus calcifications (black arrows). Abbreviations: AoV, aortic valve; CXR, chest X-ray; MV, mitral valve; PV, pulmonic valve; TV, tricuspid valve.
eFigure 35.5
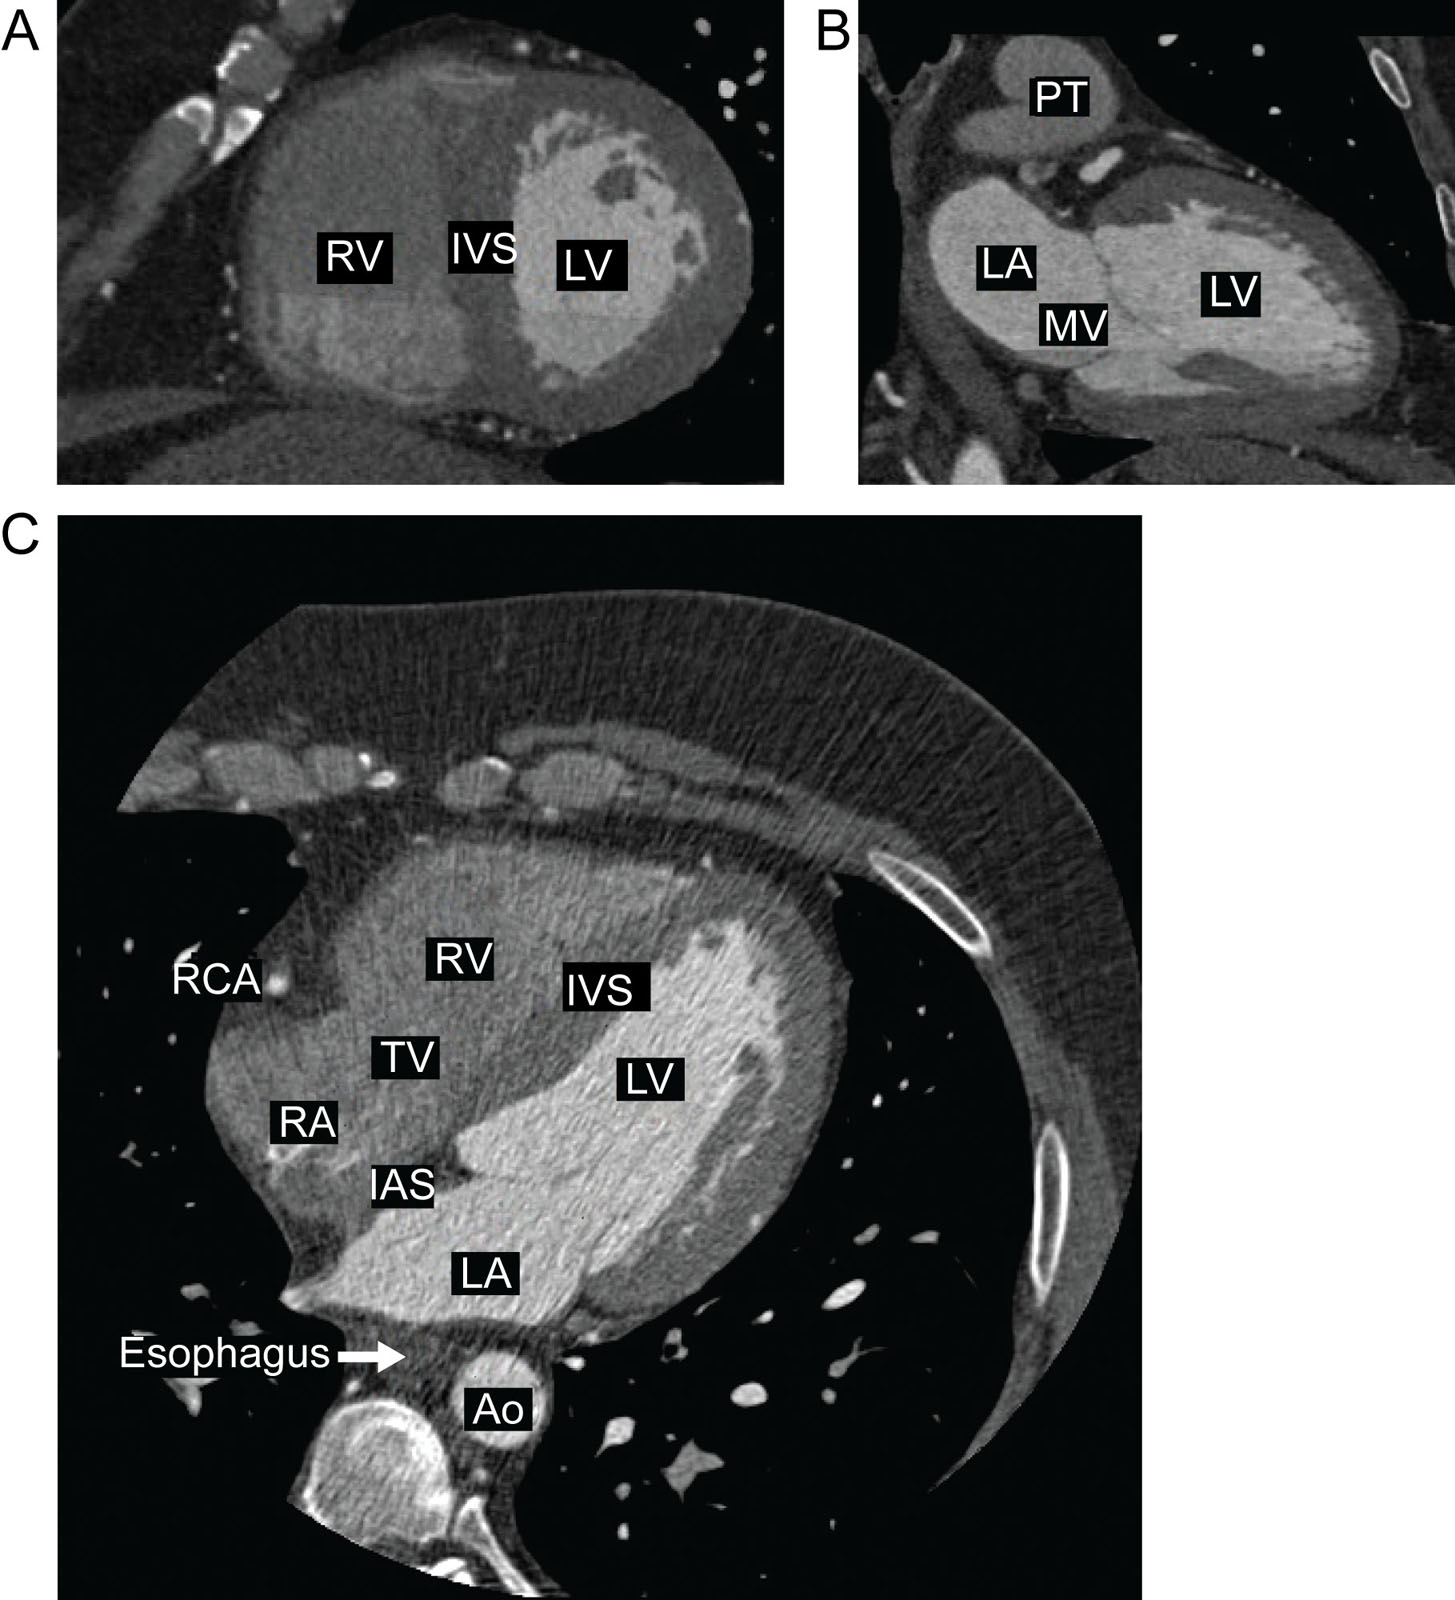
Normal anatomy on CCT. (A) CCT SAX view shows the IVS, LV, RV and allows evaluation of myocardial thickness. (B) CCT LAX or 2C view depicts the LA and LV. (C) CCT 4C view allows the general evaluation of cardiac valves and all four cardiac chambers. Abbreviations: 2C, two-chamber; 4C, four-chamber; Ao, aorta; CCT, cardiac computed tomography; IAS, interatrial septum; IVS, interventricular septum; LA, left atrium; LAX, long-axis; LV, left ventricle; MV, mitral valve; PT, pulmonary trunk; RA, right atrium; RCA, right coronary artery; RV, right ventricle; SAX, short-axis; TV, tricuspid valve.
eFigure 35.6
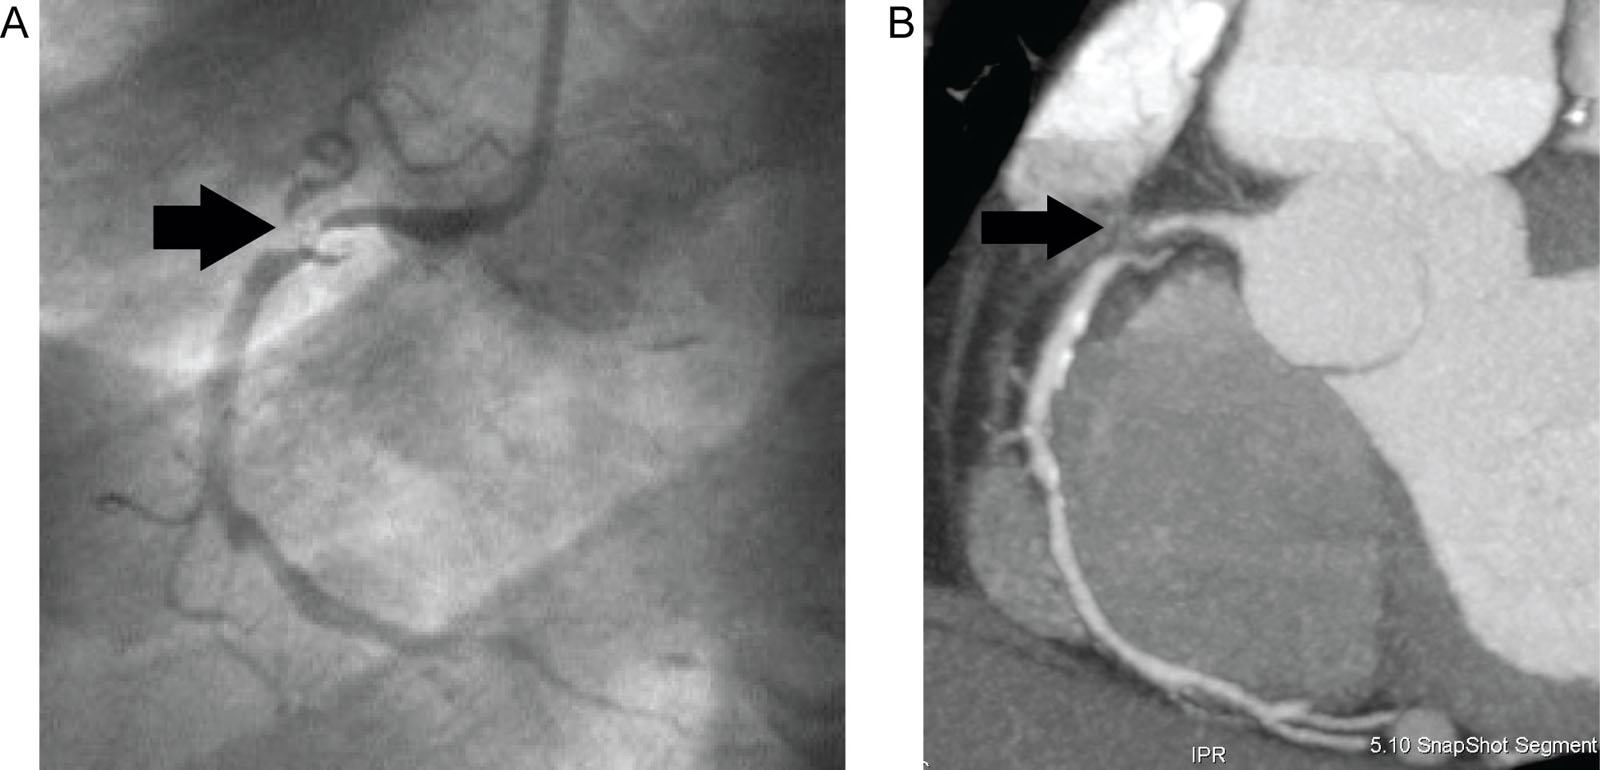
CCTA. (A) Conventional catheter angiography on a 64-year-old male with coronary disease identifies severe stenosis of the proximal RCA (black arrow). (B) CCTA of the same patient assesses the coronary walls and lumen, which show extensive atheromatous disease with a low-density plaque, causing severe subtotal stenosis of the proximal RCA (black arrow). Abbreviations: CCTA, coronary computed tomography angiography; RCA, right coronary. Source: Reproduced with permission from Bordeleau et al.12
eFigure 35.7
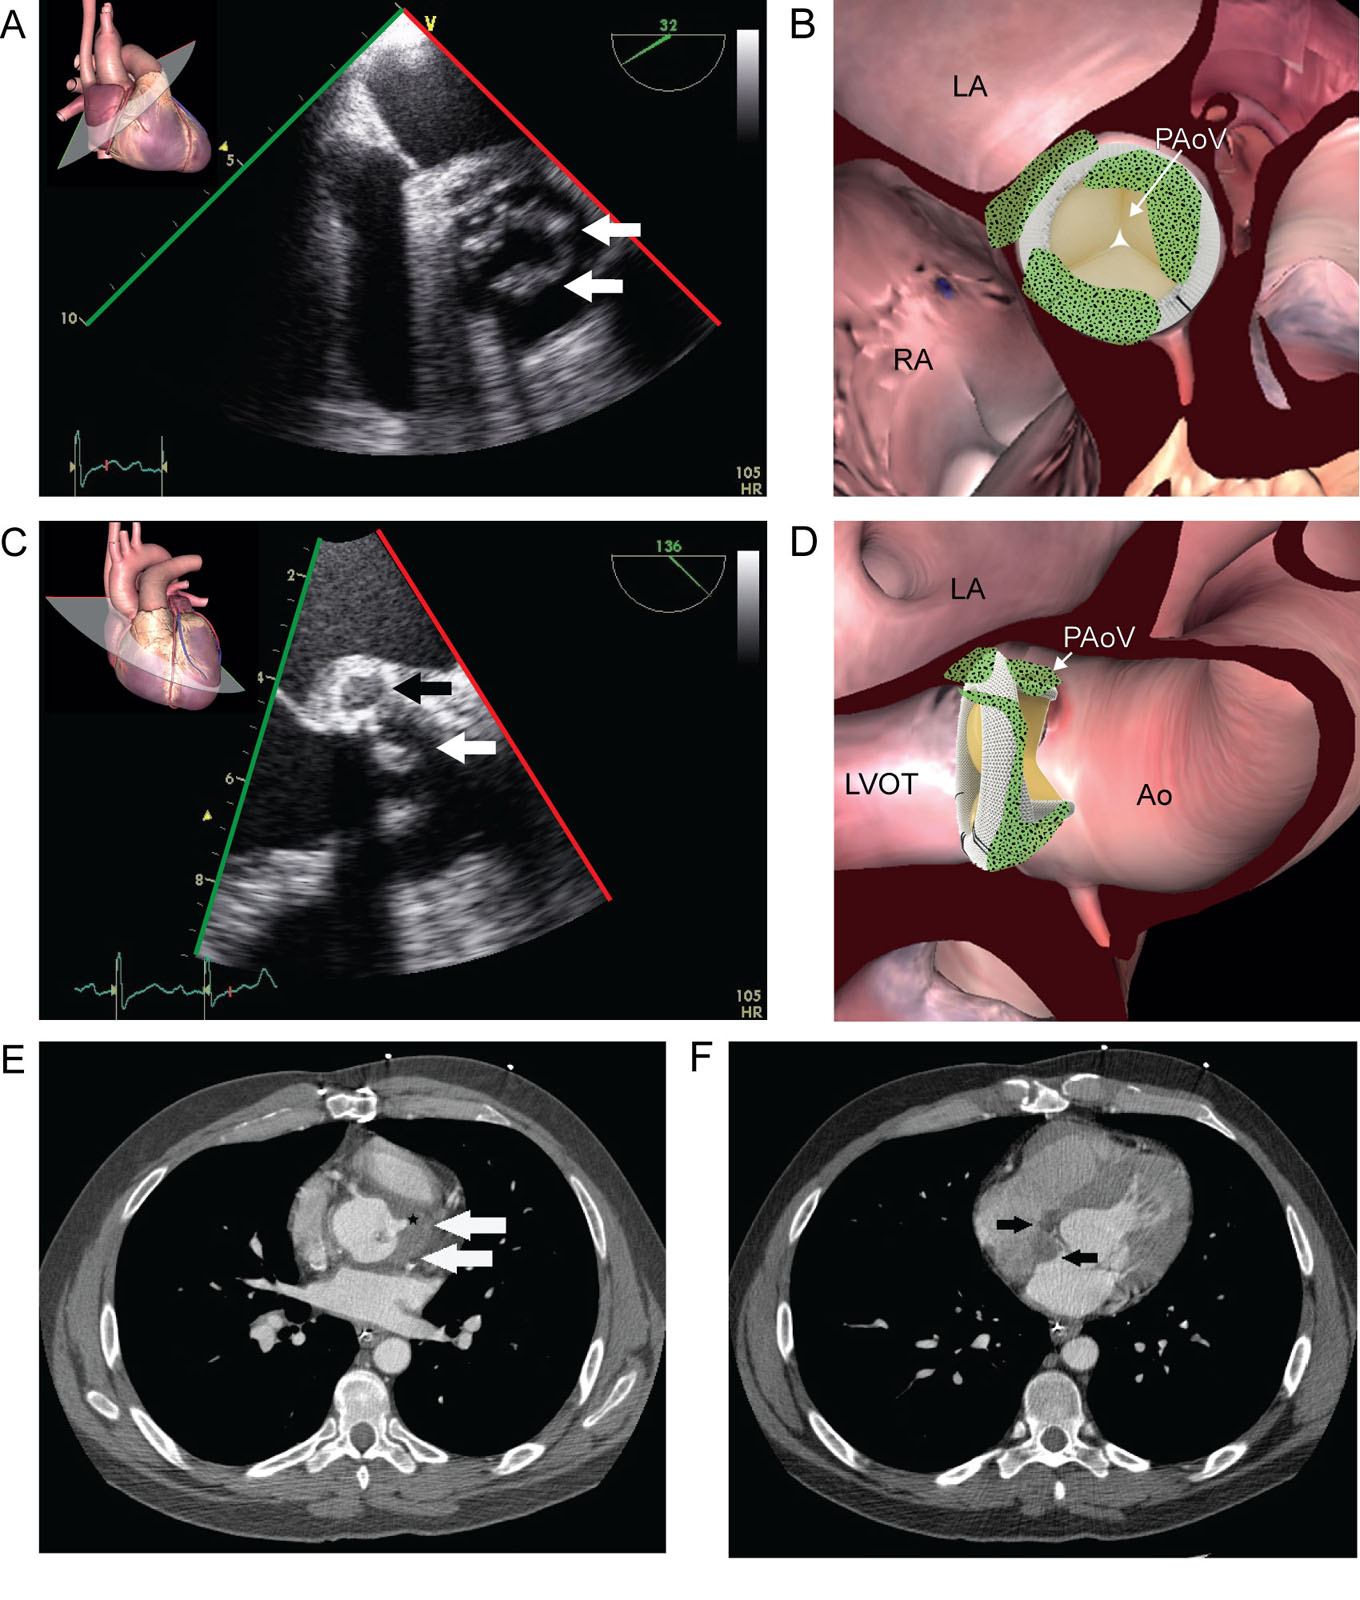
Endocarditis and perivalvular abscess. (A, B) TEE ME AoV SAX view of a 44-year-old male with a previous bioprosthetic AoV replacement shows thickened and irregular valve cusps (white arrows) suggestive of endocarditis. (C, D) TEE ME AoV LAX shows thickening in the posterior aortic root with a less dense central area (black arrow) consistent with an abscess. (E) CCT images of the same patient detect the anterior portion of the perivalvular abscess (white arrows) seen as an adjacent hypodense collection with faint wall enhancement. There is also a blunt tract (black star), that has not yet fistulized, and (F) the involvement of the interatrial septum (black arrows). Abbreviations: Ao, aorta; AoV, aortic valve; CCT, cardiac computed tomography; LA, left atrium; LAX, long-axis; LVOT, left ventricular outflow tract; ME, mid-esophageal; PAoV, prosthetic aortic valve; RA, right atrium; SAX, short-axis; TEE, transesophageal echocardiography.
eFigure 35.8
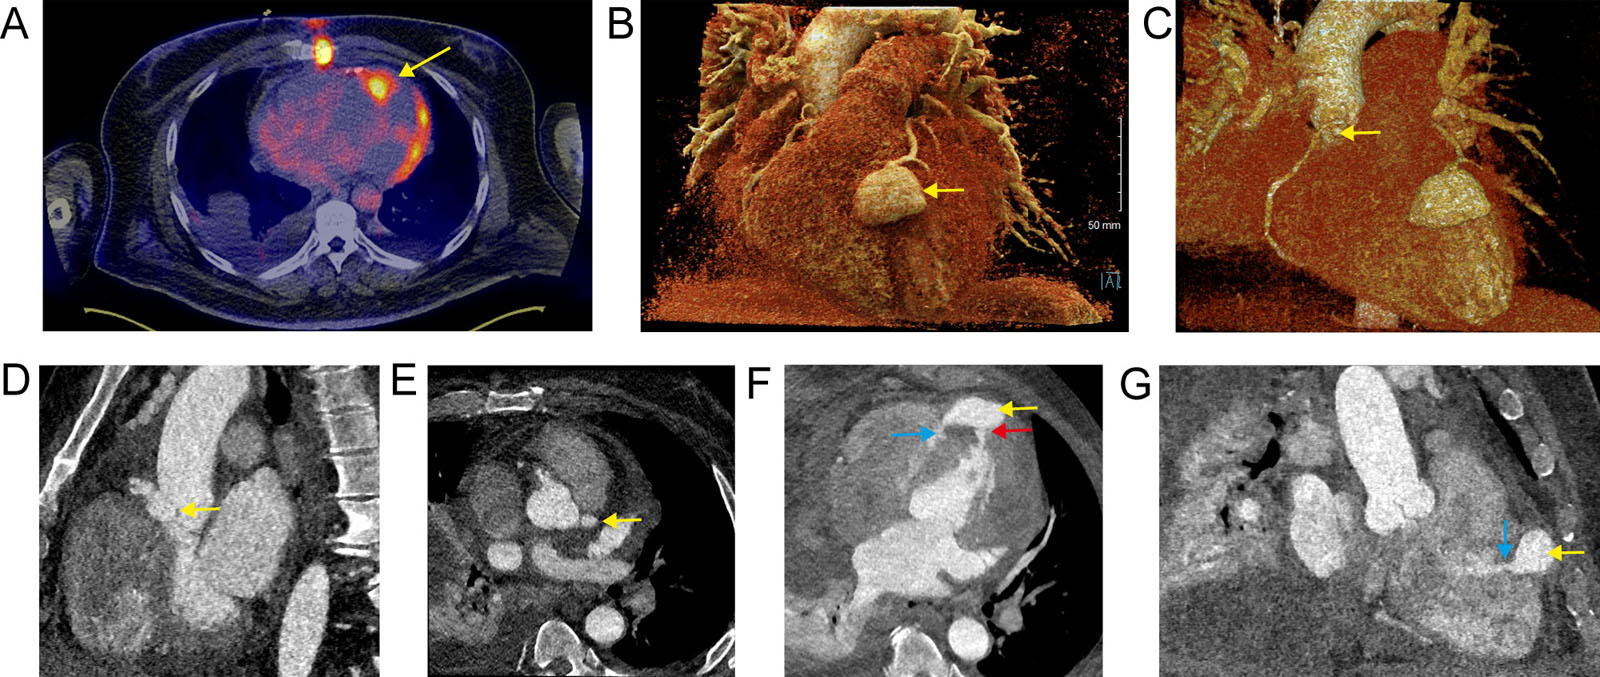
Mycotic aneurysm imaging. (A) Axial slice of fused PET and CT scan shows the abnormal uptake at the end of the LAD coronary, representing the mycotic aneurysm (yellow arrow). Additional uptake of the LV lateral wall and at the sternum is present. (B-E) CCT angiography with prospective ECG-gating and intravenous contrast (iopamidol 370) in arterial phase. The yellow arrow indicates a 3D volume rendering and 2D of the (B) LAD, (C, D) RCA and (E) left main mycotic aneurysms. (F, G) The red arrow indicates the fistula to the LV and the blue arrow, the fistula to the RV. Abbreviations: 2D, two-dimensional; 3D, three-dimensional; CCT, cardiac computed tomography; CT, computed tomography; ECG, electrocardiographic; LAD, left anterior descending; LV, left ventricle; PET, positron emission tomography; RCA, right coronary artery; RV, right ventricle. Adapted from Ogondon et al. 56
eFigure 35.9
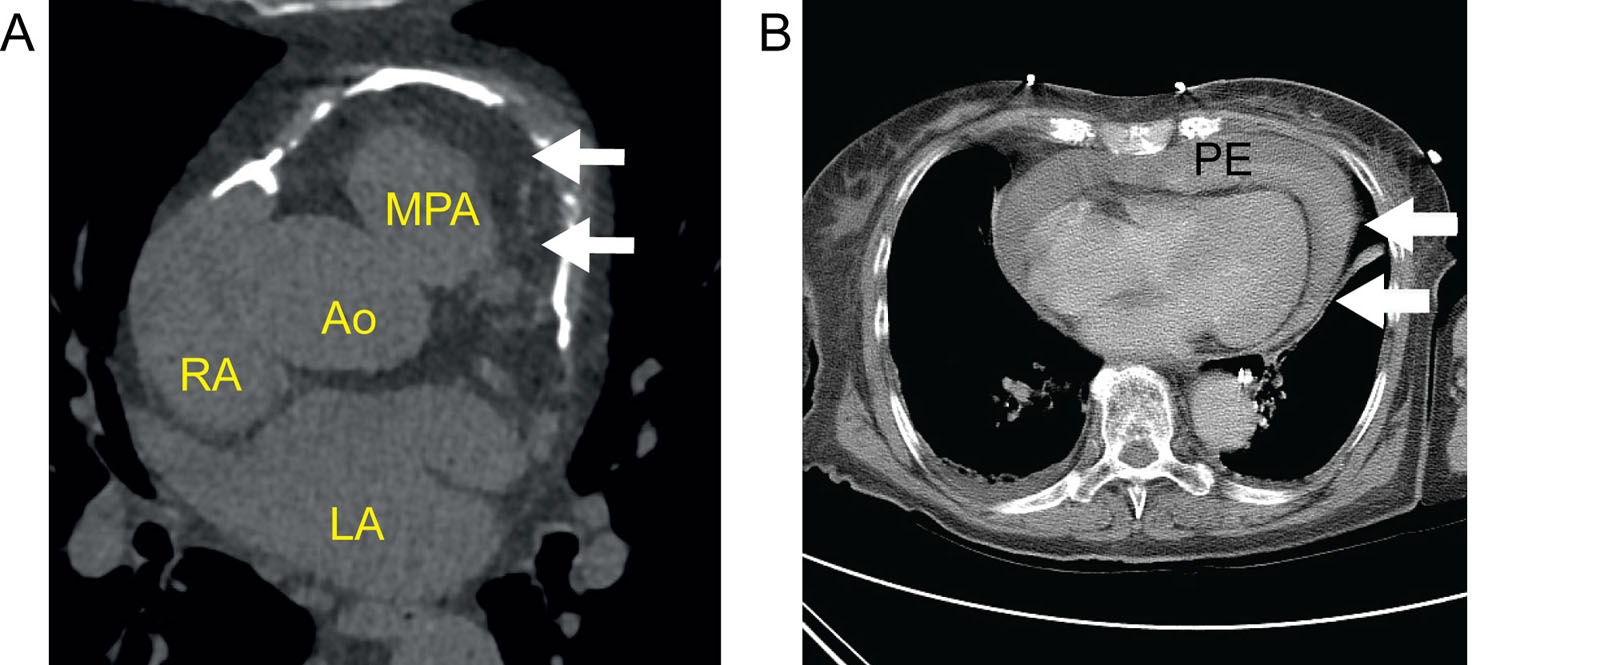
Pericardial effusion. (A) Axial CT view of the upper portion of the heart showing anterior pericardial calcification in a patient with constrictive pericarditis. (B) Axial contrast-enhanced CT of a 90-year-old female presenting with chest pain depicts a moderate PE with high attenuation (white arrows), indicating a hemorrhagic effusion. Abbreviations: Ao, aorta; CT, computed tomography; LA, Left atrium; MPA, main pulmonary artery; PE, pericardial effusion; RA, right atrium.
eFigure 35.10
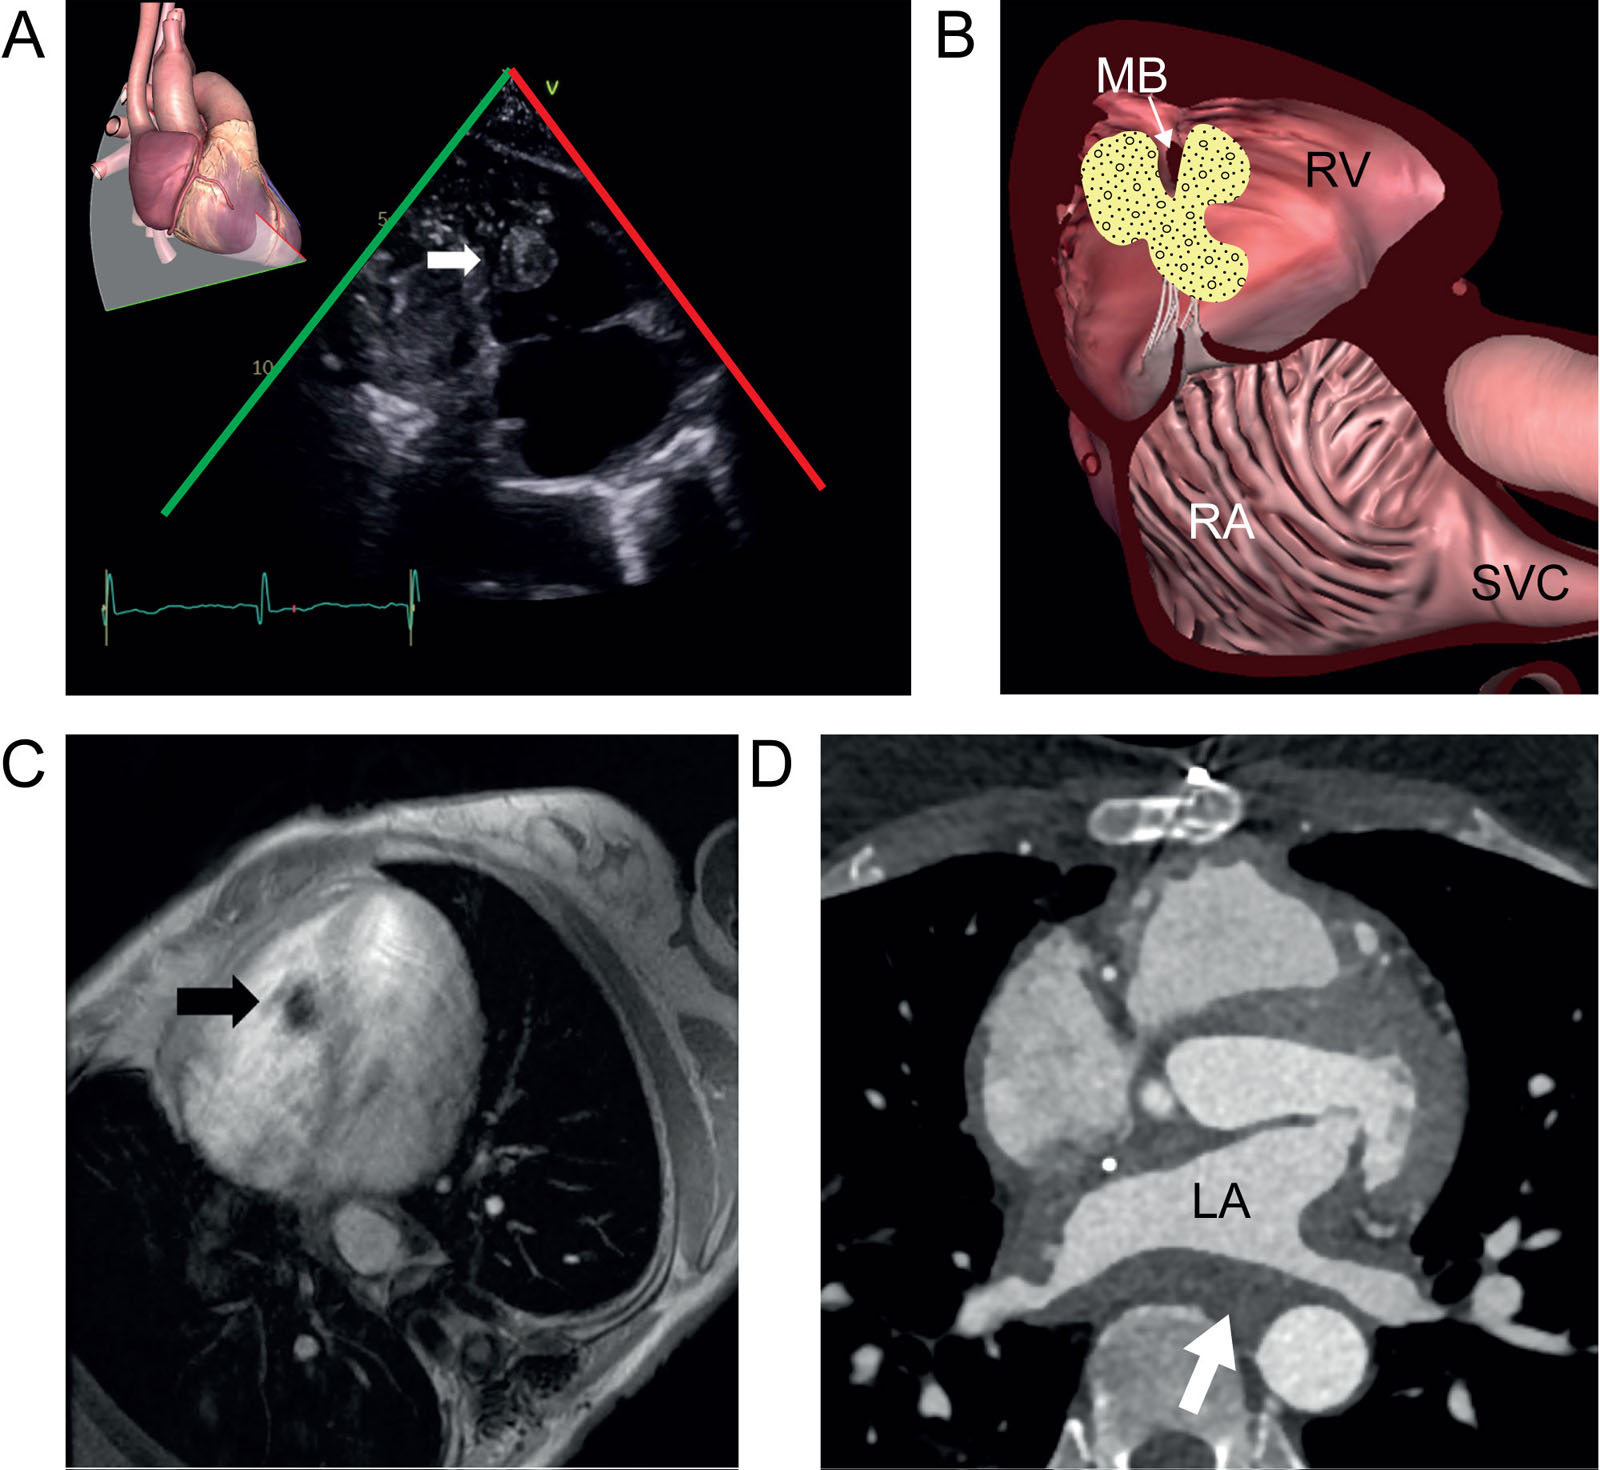
Endocavitary metastasis. (A, B) TTE subcostal RV 2C view of a 72-year-old female known for a colorectal cancer shows one of many endocavitary RV masses (white arrow). (C) Cardiac MRI of the same patient confirms a triangular, irregular hypointense lesion next to the moderator band (black arrow) corresponding to a metastasis. (D) LA sarcoma associated with wall thickening from myocardium invasion. Abbreviations: 2C, two-chamber; LA, left atrium; MB, moderator band; MRI, magnetic resonance imaging; RA, right atrium; RV, right ventricular; SVC, superior vena cava; TTE, transthoracic echocardiography.
eFigure 35.11
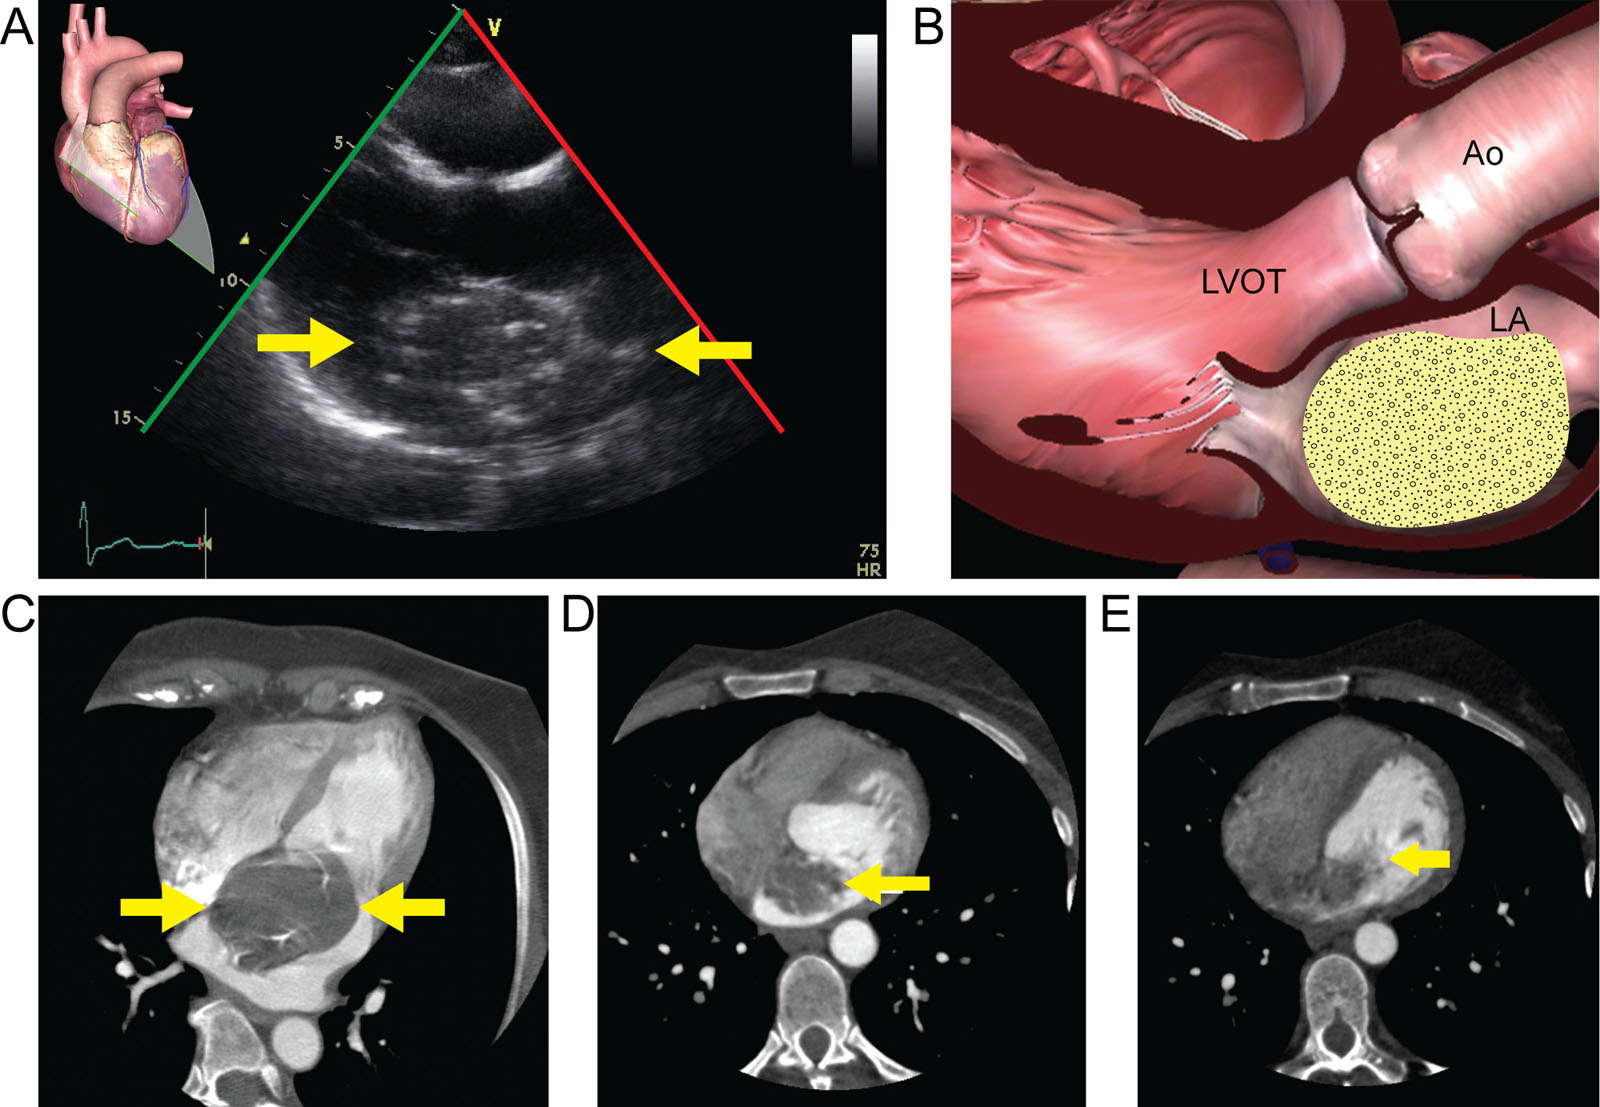
Myxoma. (A, B) TTE of a 62-year-old female shows a hyper-echoic mass (white arrows) with punctuate calcifications in the LA. (C) CCT of the same patient depicts the hypodense mass (white arrow) with calcifications, which was an LA myxoma. Note that the mass is in contract with the IAS, which is an imaging sign highly specific for myxoma, as most atrial myxomas attach here. (D) CCT of a 45-year-old female shows a hypo enhancing LA mass (white arrow) that has a sessile attachment to the IAS. (E) Same CCT exam showing the prolapse of the mass through the MV (white arrow). Abbreviations: Ao, aorta; CCT, cardiac computed tomography; IAS, interatrial septum; LA, left atrium; LVOT, left ventricular outflow tract; MV, mitral valve; TTE, transthoracic echocardiography.
eFigure 35.12
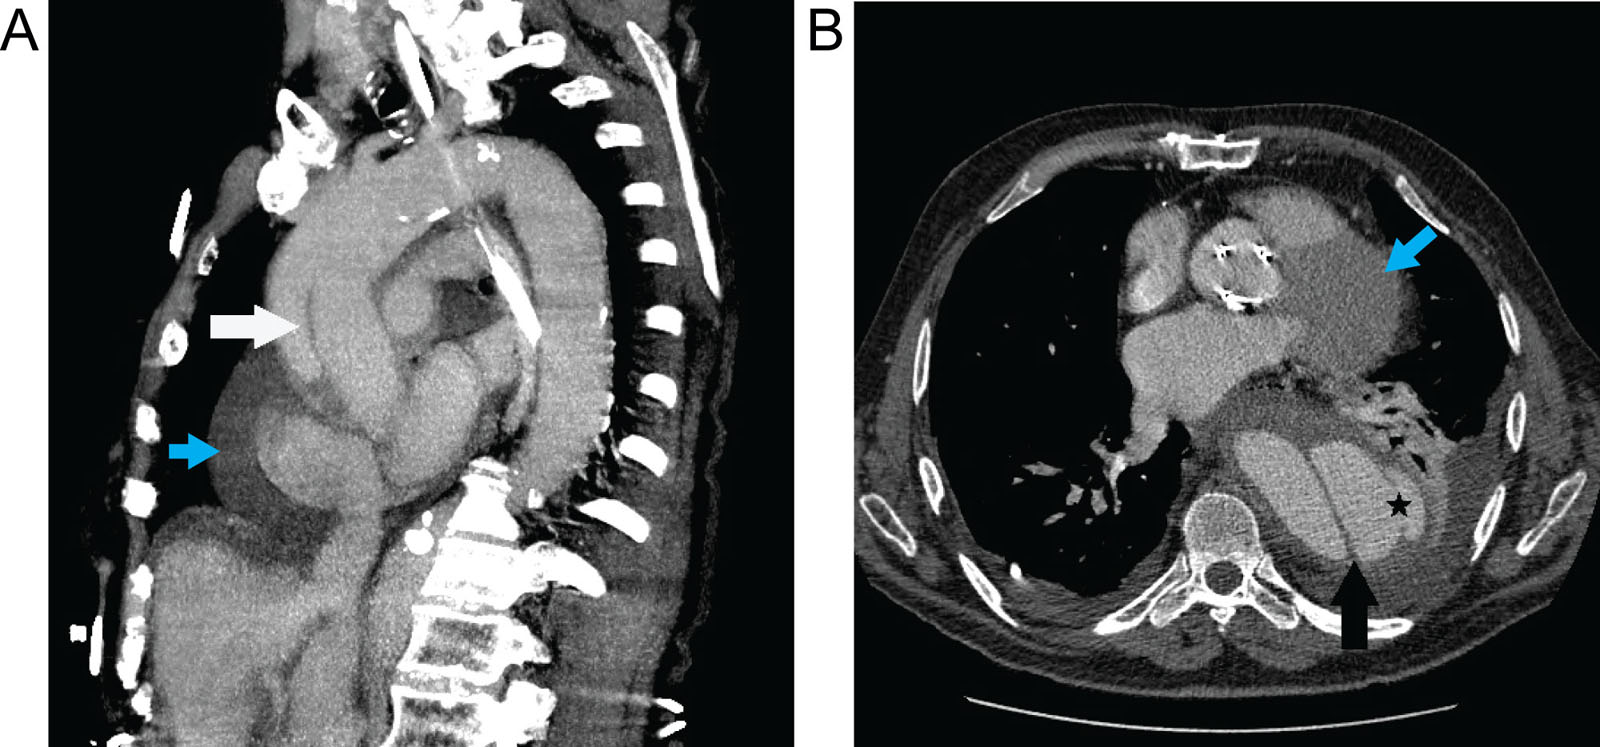
Aortic dissection. (A) CCT images of a 78-year-old male with acute chest pain depict thoracic aortic dissection (white arrow in a sagittal image), (B) that appears ruptured (black star) with an associated PE (blue arrows) and a left pleural effusion. Abbreviations: CCT, cardiac computed tomography; PE, pericardial effusion.
eFigure 35.13
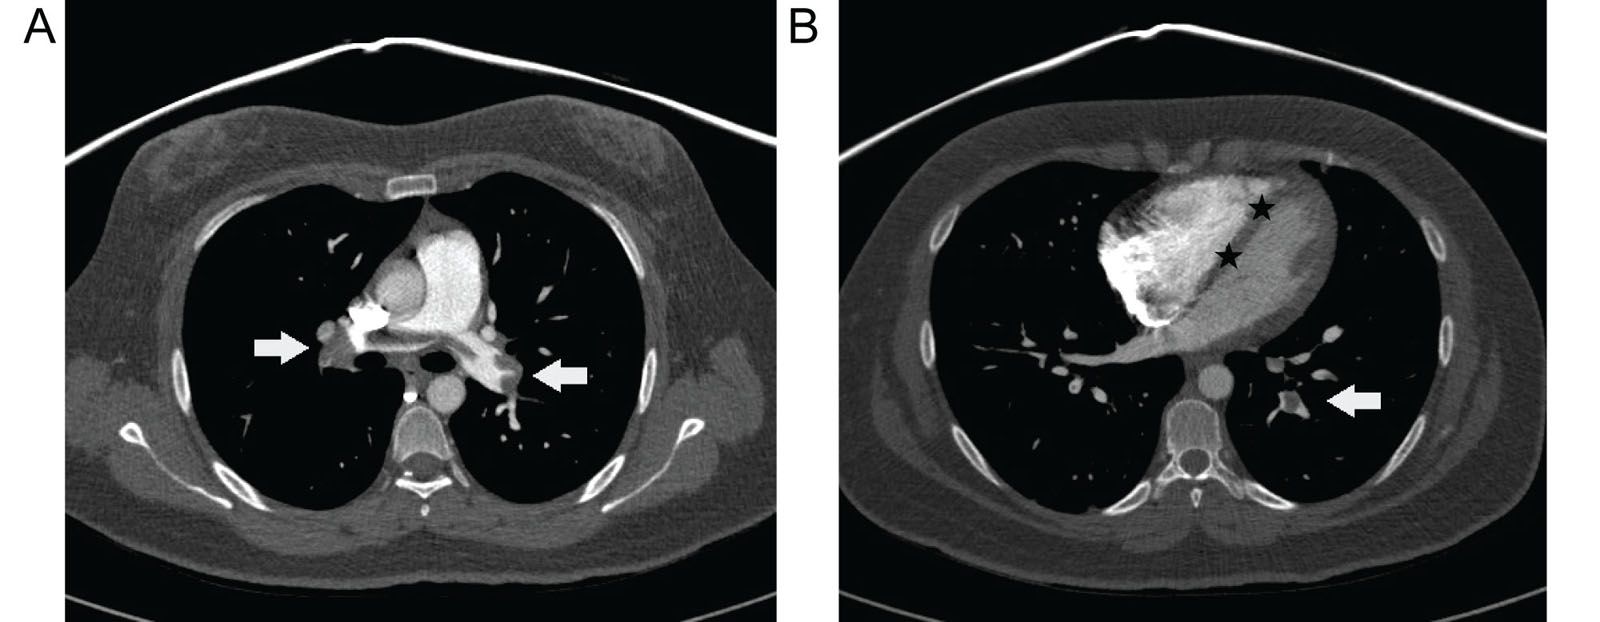
Pulmonary embolism. (A) Pulmonary CT angiography axial images of a 30-year-old female presenting with acute chest pain demonstrate central pulmonary emboli, or “saddle emboli” in the main pulmonary arteries (white arrows). (B) A straight IVS (black stars) suggests RV overload. Abbreviations: CT, computed tomography; IVS, interventricular septum; RV, right ventricular.
eFigure 35.14
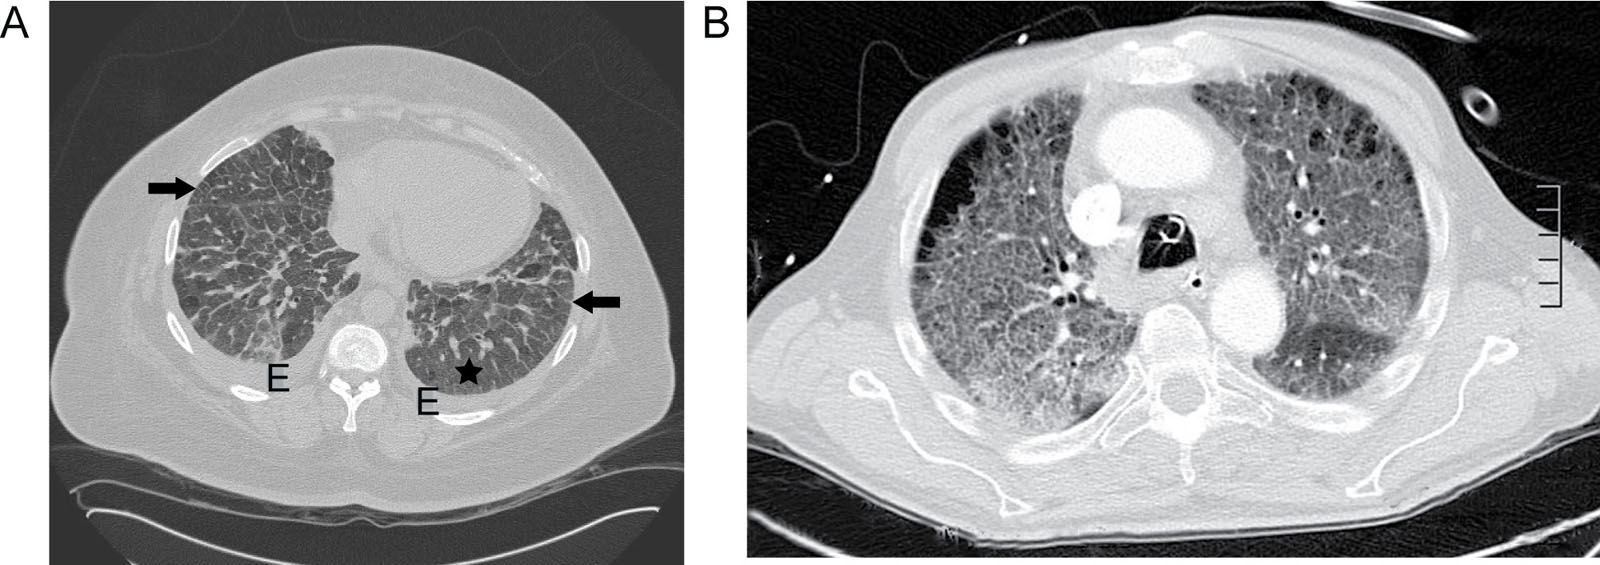
Pulmonary edema and fibrosis. (A) CCT axial images of a 49-year-old female with acute dyspnea show thickened interlobular septa (black arrows), ground-glass opacities (black star), and bilateral small pleural effusions indicating pulmonary edema. (B) Pulmonary CT showing pulmonary fibrosis without a pleural effusion in a 63-year-old male. Abbreviations: CCT, cardiac computed tomography; CT, computed tomography; E, effusion.
eFigure 35.15
Myocardial ischemia. MRI 4C view shows apical transmural late gadolinium enhancement (arrow) with an aneurysmal dilation typical of LAD territory infarct. Abbreviation: 4C, four-chamber; LA, left atrium; LAD, left anterior descending; LV, left ventricle; MRI, magnetic resonance imaging; RA, right atrium; RV, right ventricle.
eFigure 35.16
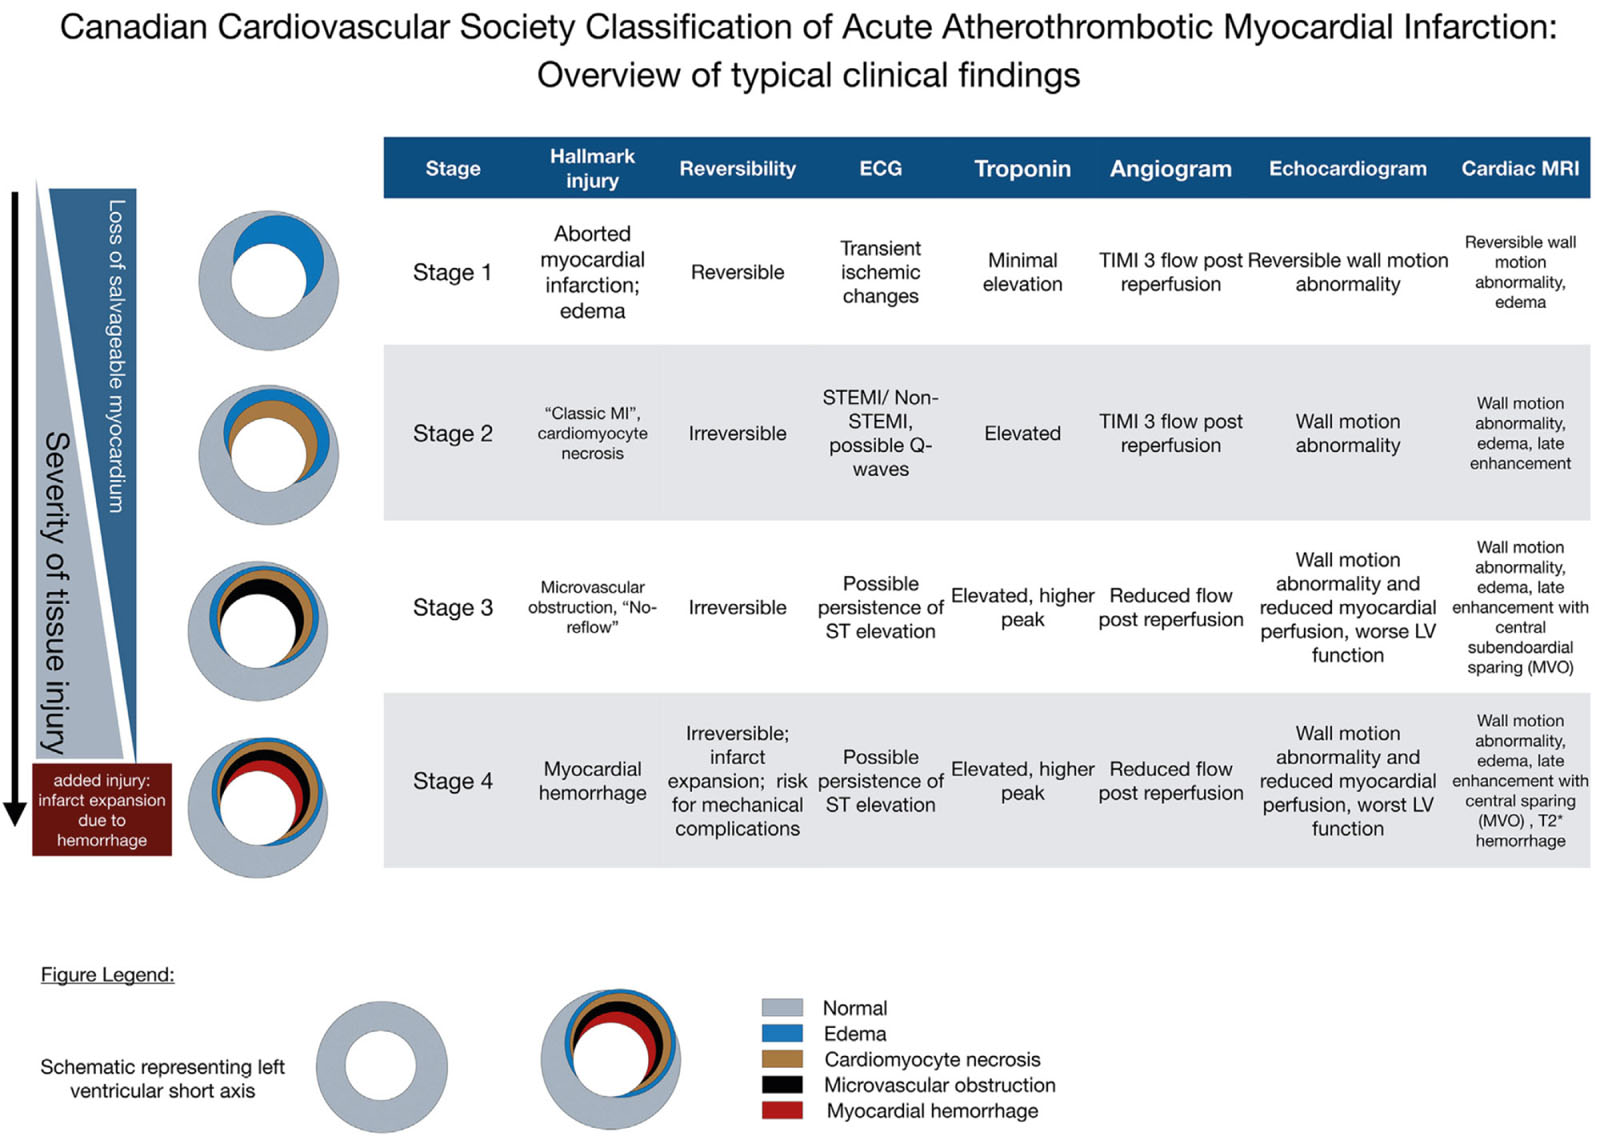
Overview of typical clinical findings at each stage of the CCS classification of acute atherothrombotic myocardial infarction (CCS-AMI). Typical changes are shown; precise diagnostic criteria will require further research and expert consensus. The stages build on each other, reflecting progression of the severity of tissue injury. Timely reperfusion can halt tissue injury at an earlier stage and prevent progression to a more severe stage of injury. Hemorrhagic infarction is the worst stage, can cause infarct expansion, and is associated with mechanical complications. Wall motion abnormalities and electrocardiogram (ECG) changes also depend on the size of the affected myocardium. Abbreviations: CCS-AMI, Canadian Cardiovascular Society Classification of Acute Atherothrombotic Myocardial Infarction; LV, left ventricle; MI, myocardial infarction; MRI, magnetic resonance imaging; MVO, microvascular obstruction; STEMI, ST-elevation myocardial infarction; TIMI, Thrombolysis In Myocardial Infarction. With permission from Kumar et al. 38
eFigure 35.17
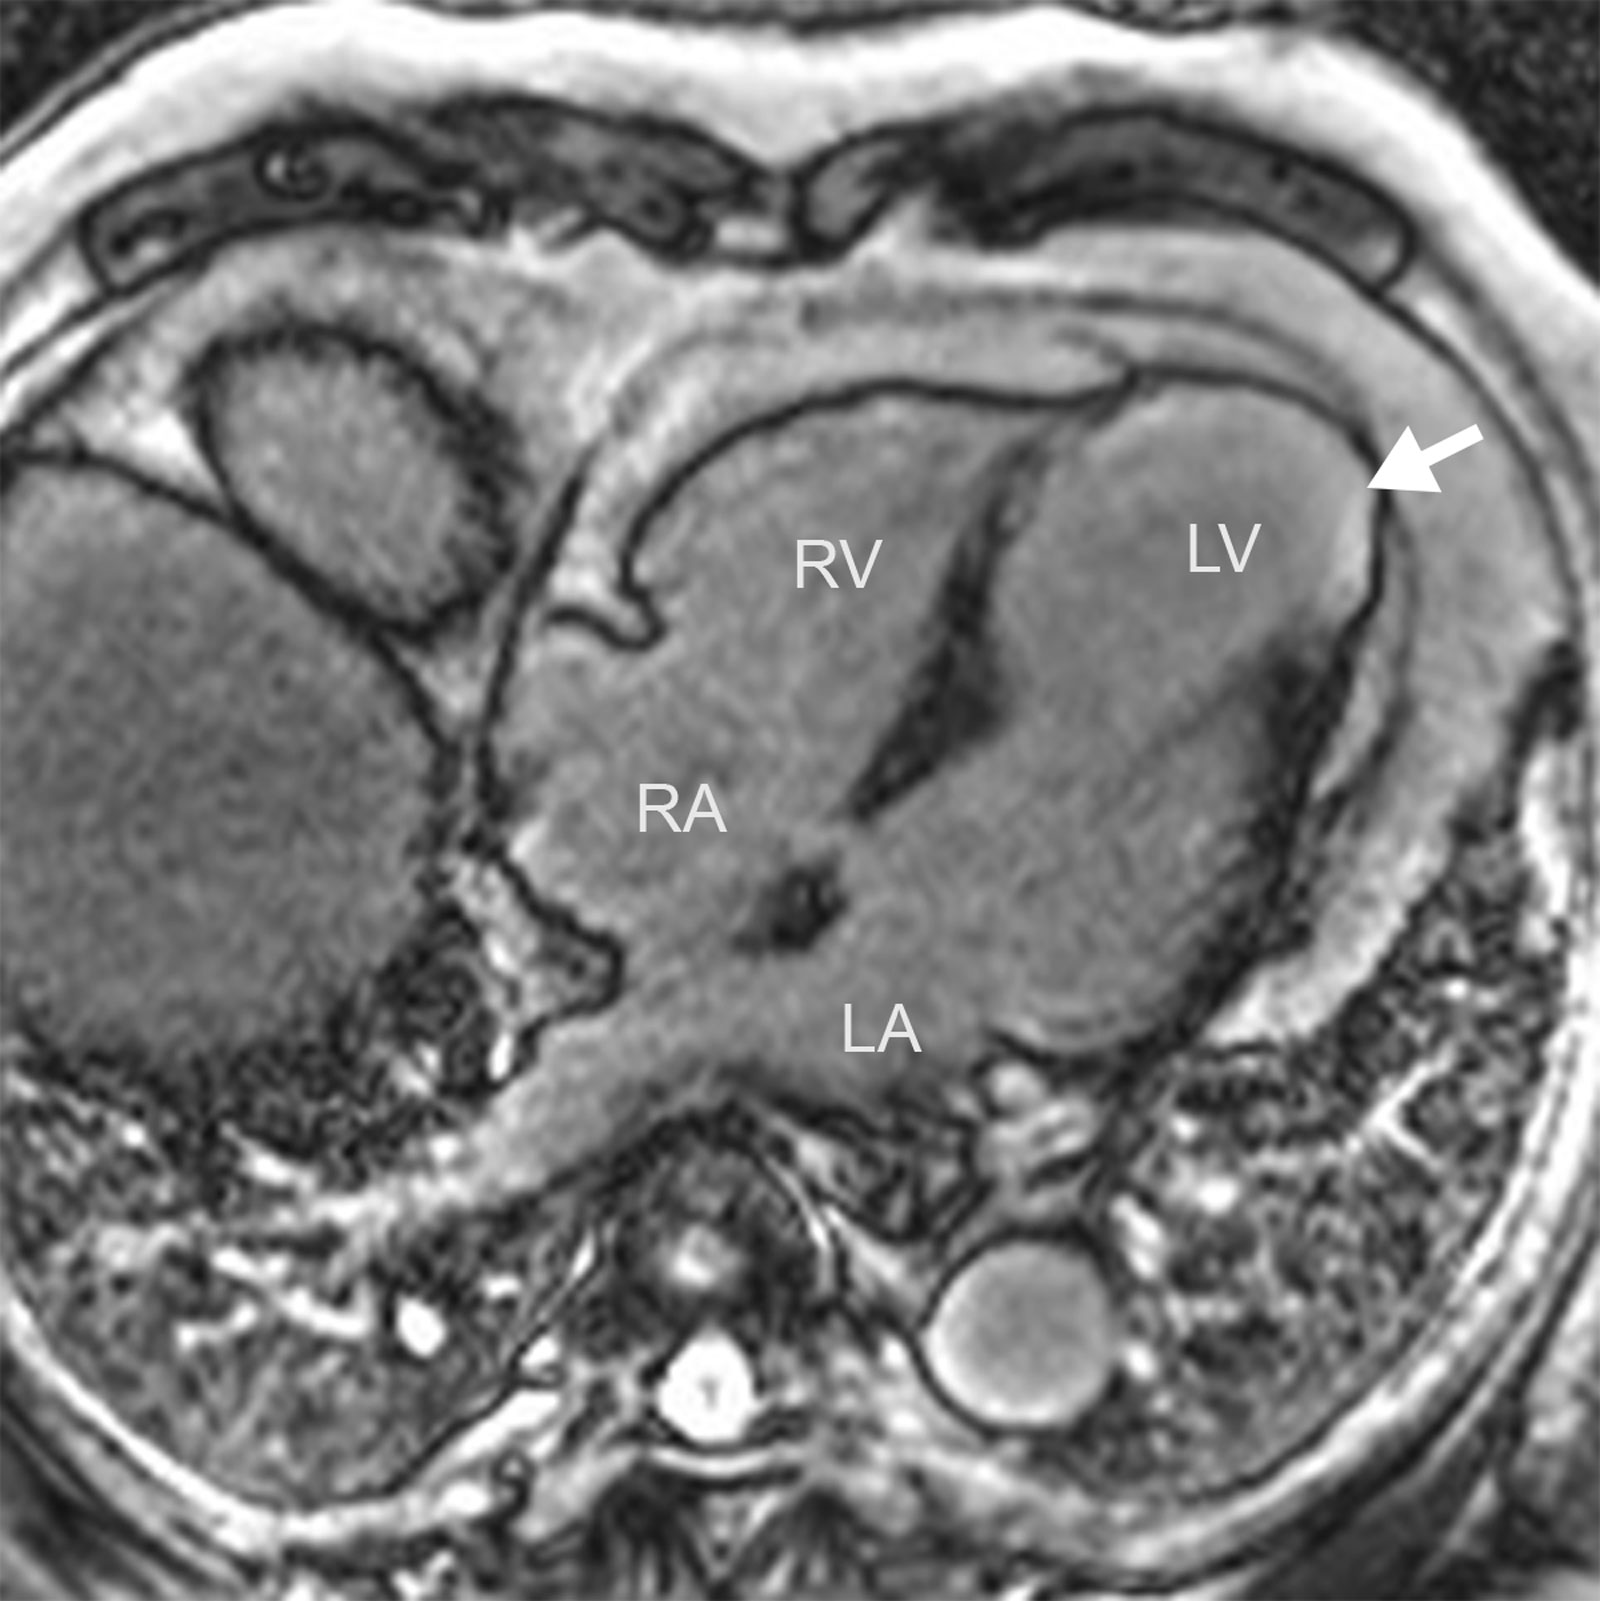
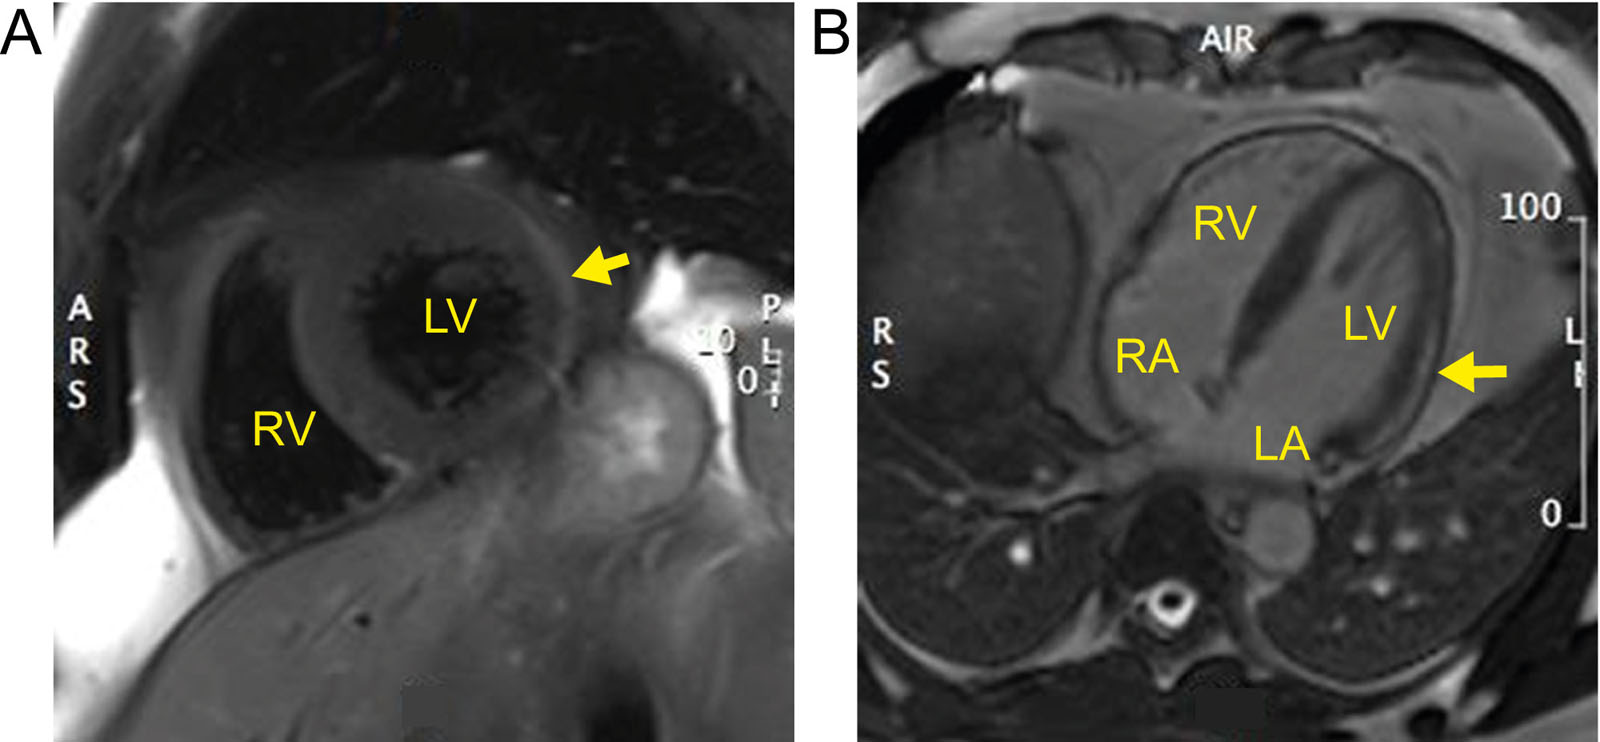
Myocarditis. (A) Spectral attenuated inversion recovery (SPAIR) t2-weighted imaging shows edema over the lateral wall in a patient with viral myocarditis. (B) Sub-epicardial late gadolinium enhancement within the LV lateral wall (arrow) in a patient with viral myocarditis. Abbreviations: ARS, anterior right side; L, left; LA, left atrium; LV, left ventricular; PL, posterior left; RA, right atrium; RS, right side; RV, right ventricle.
eFigure 35.18
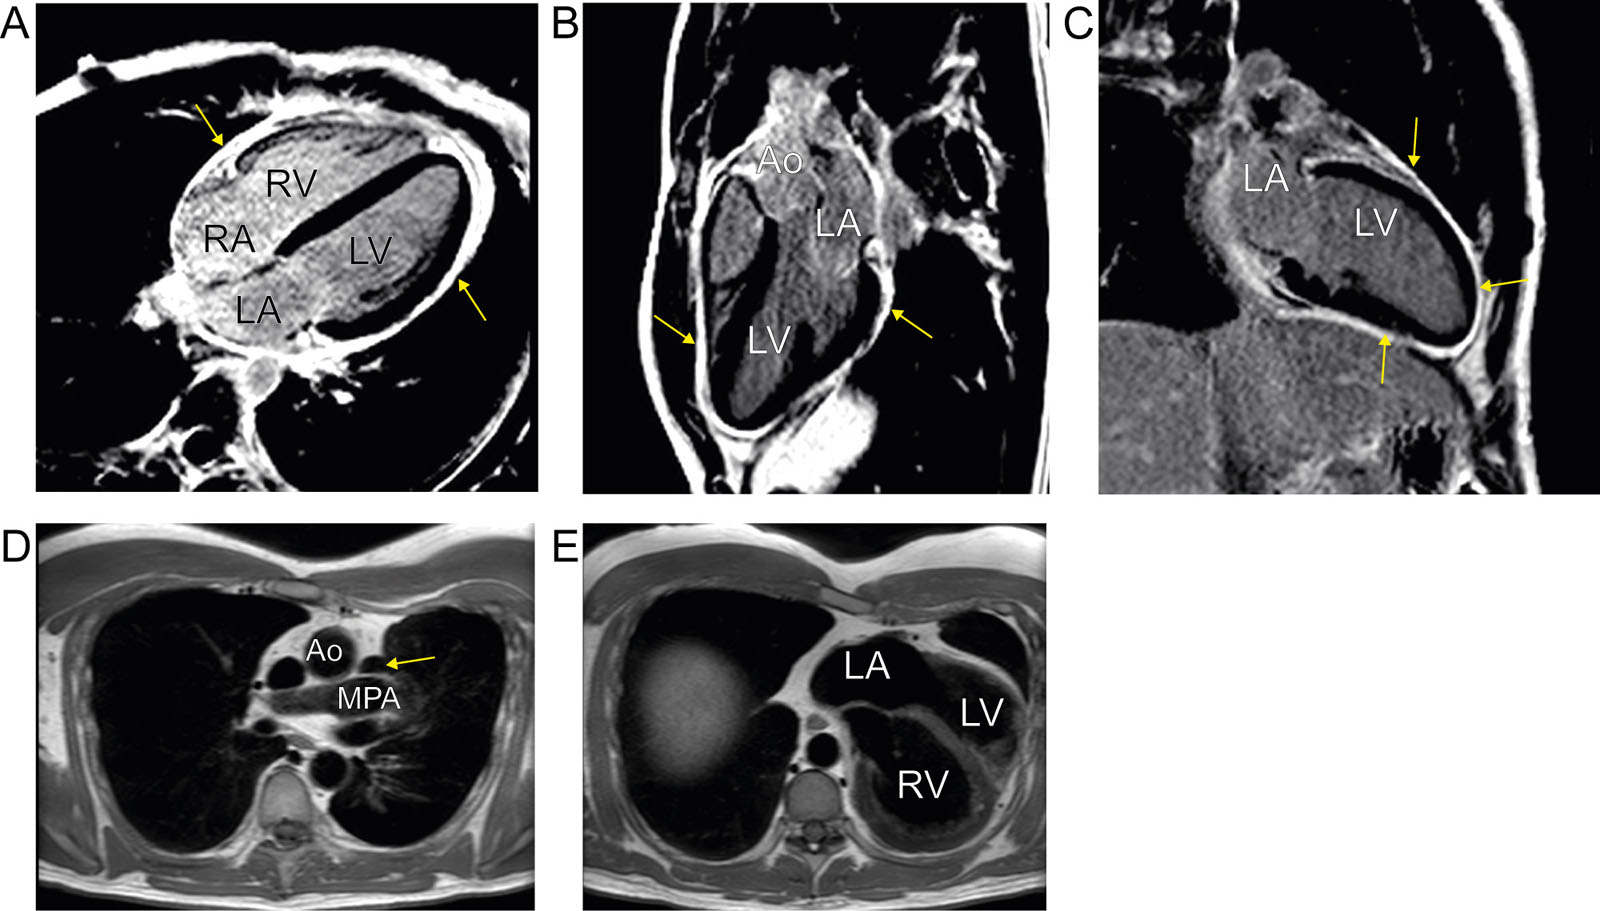
Pericardial abnormalities. (A-C) MRI views showing diffuse pericardial circumferential thickening (arrow) and enhancement in a patient with recurrent pericarditis. (D) Congenital absence of a pericardium. Note the appearance of lung (arrow) between the Ao and the MPA. (E) Axial black blood sequence. There is levocardia related to partial agenesis of the pericardium. Abbreviation: Ao, aorta; LA, left atrium; LV, left ventricle; MPA, main pulmonary artery; MRI, magnetic resonance imaging; RA, right atrium; RV, right ventricle.
eFigure 35.19
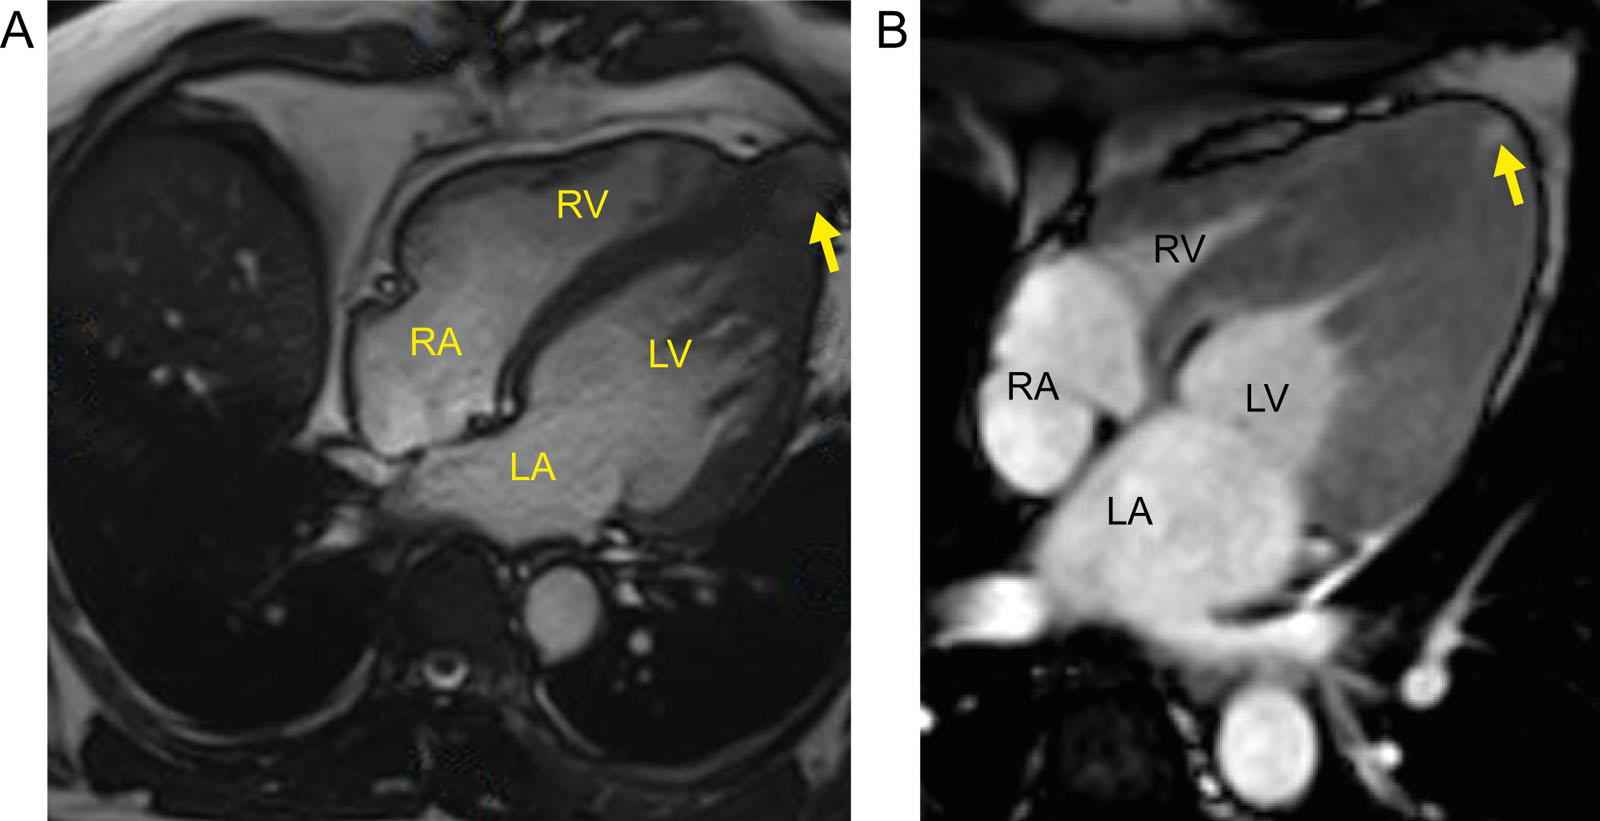
Amyloidosis. MRI with diffuse late gadolinium enhancement in a patient with cardiac amyloidosis. Atrial wall late gadolinium enhancement also appears. Abbreviation: LA, left atrium; LV, left ventricle; MRI, magnetic resonance imaging.
eFigure 35.20
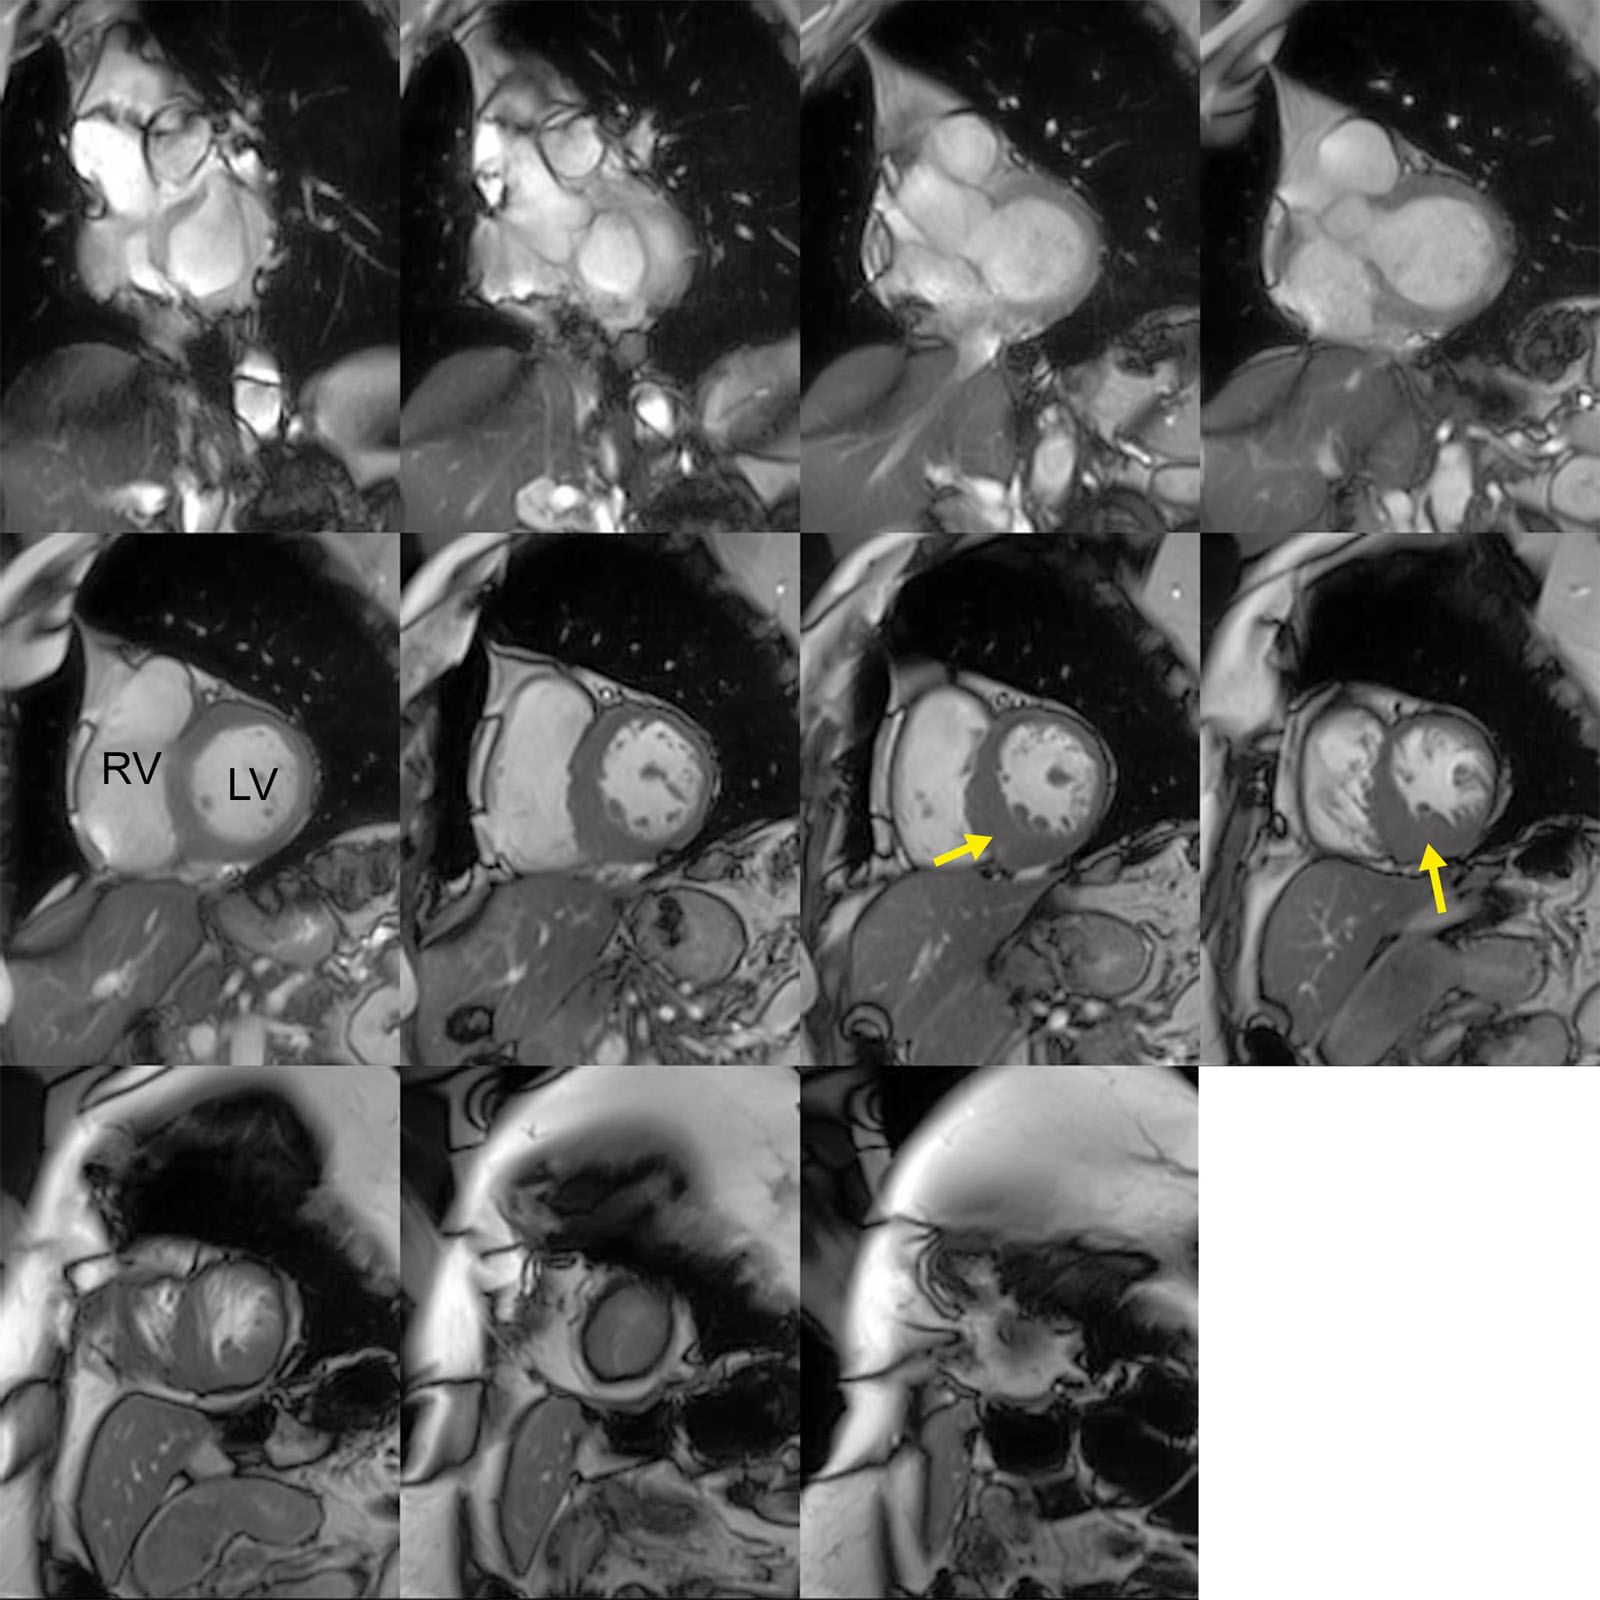
HCM. MRI SAX views in a patient with asymmetric HCM involving predominantly the inferoseptal and inferior wall variant (arrow). Abbreviations: HCM, hypertrophic cardiomyopathy; LV, left ventricle; MRI, magnetic resonance imaging; RV, right ventricle; SAX, short-axis.
eFigure 35.21
HCM and apical aneurysm. (A, B) MRI showing apical HCM with early (A) LV aneurysm formation (arrow) and (B) a smaller microaneurysm (arrow) using contrast. Abbreviations: HCM hypertrophic cardiomyopathy; LA, left atrium; LV, left ventricular; MRI, magnetic resonance imaging; RA, right atrium; RV, right ventricle.
eFigure 35.22
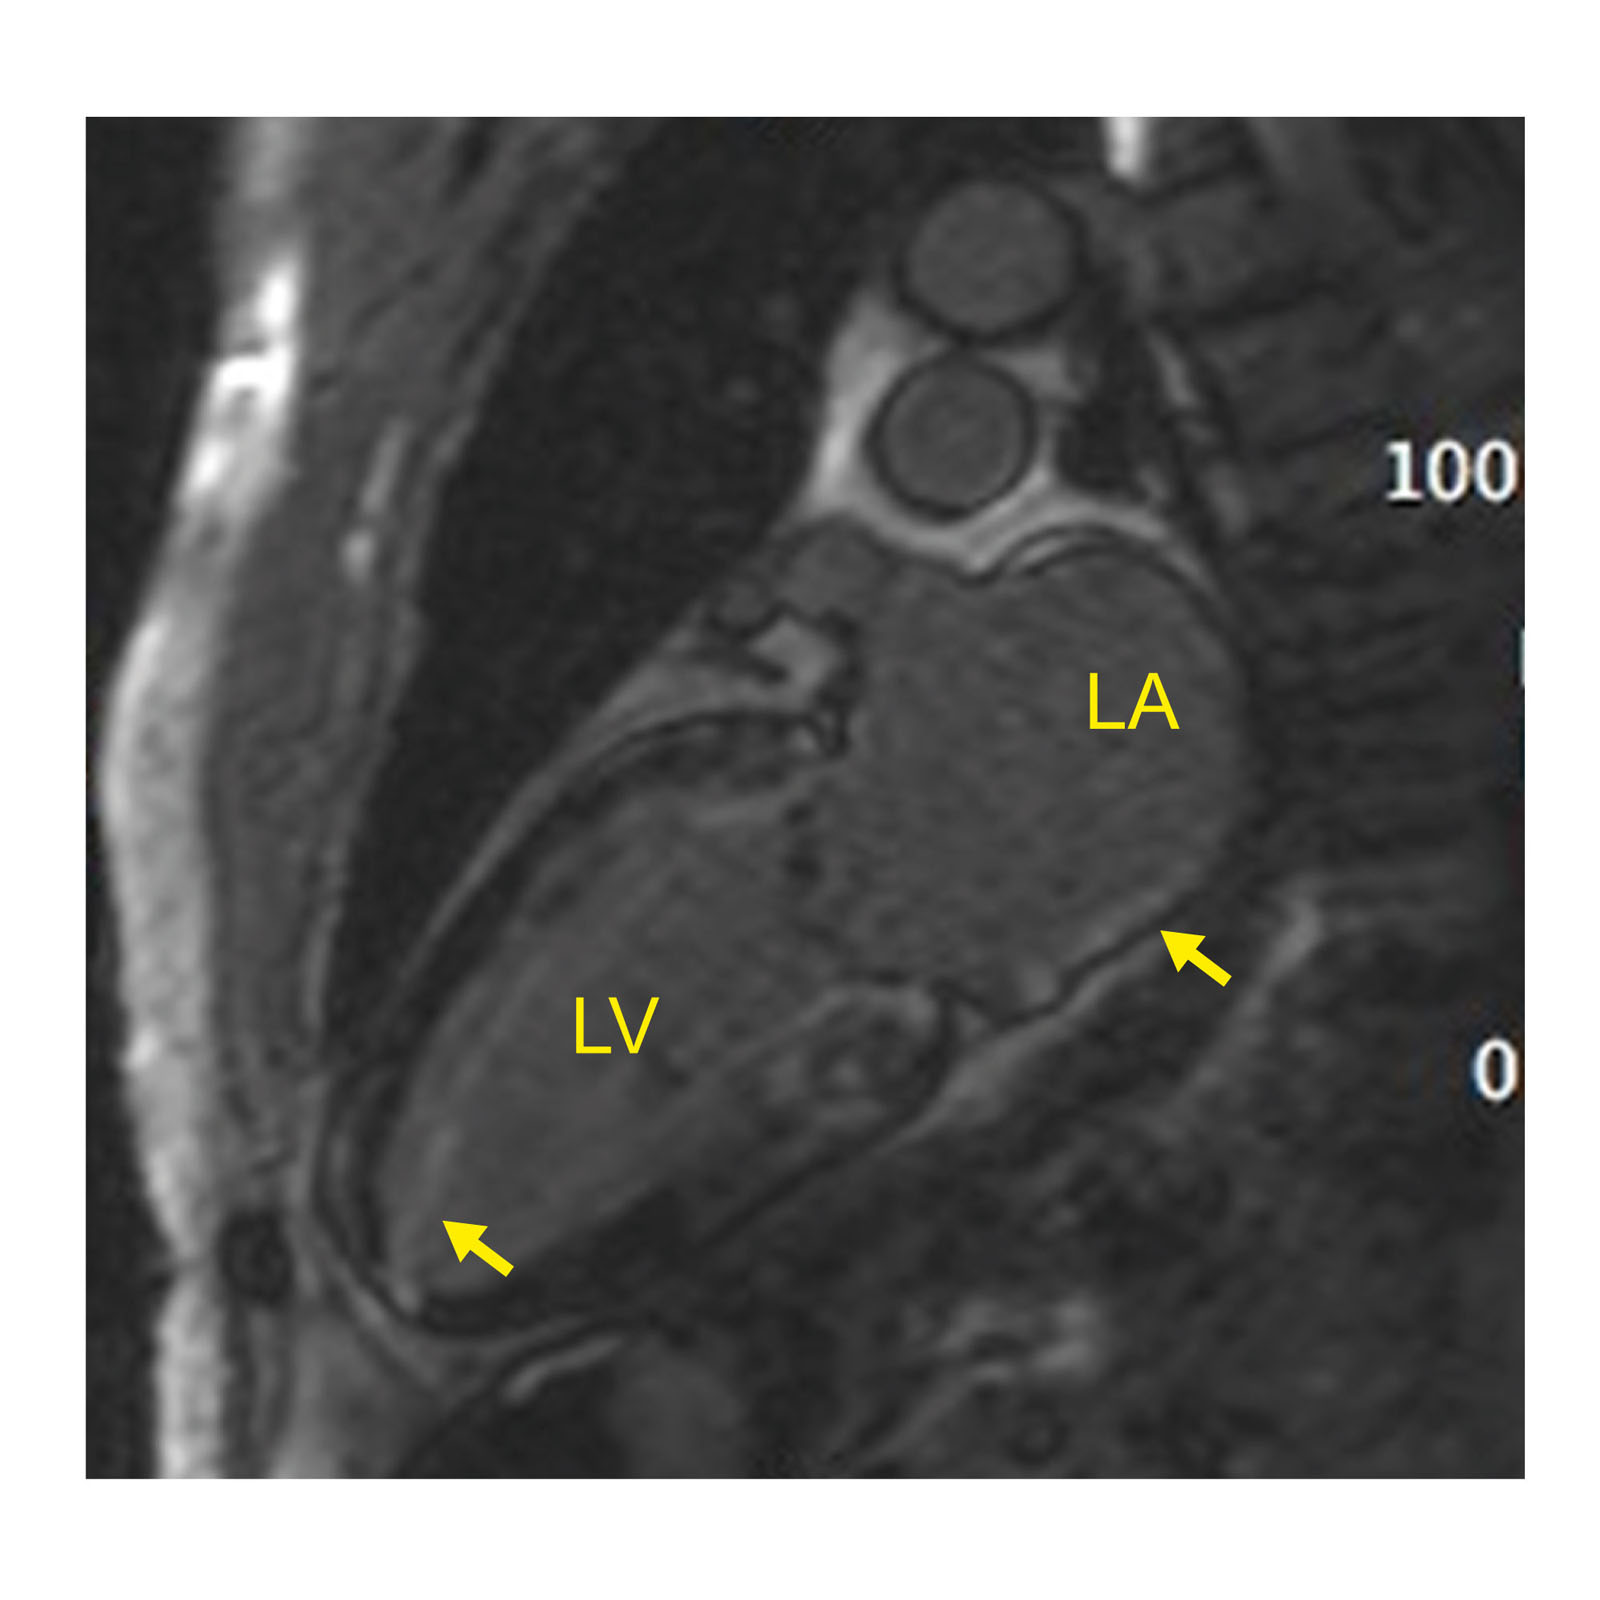
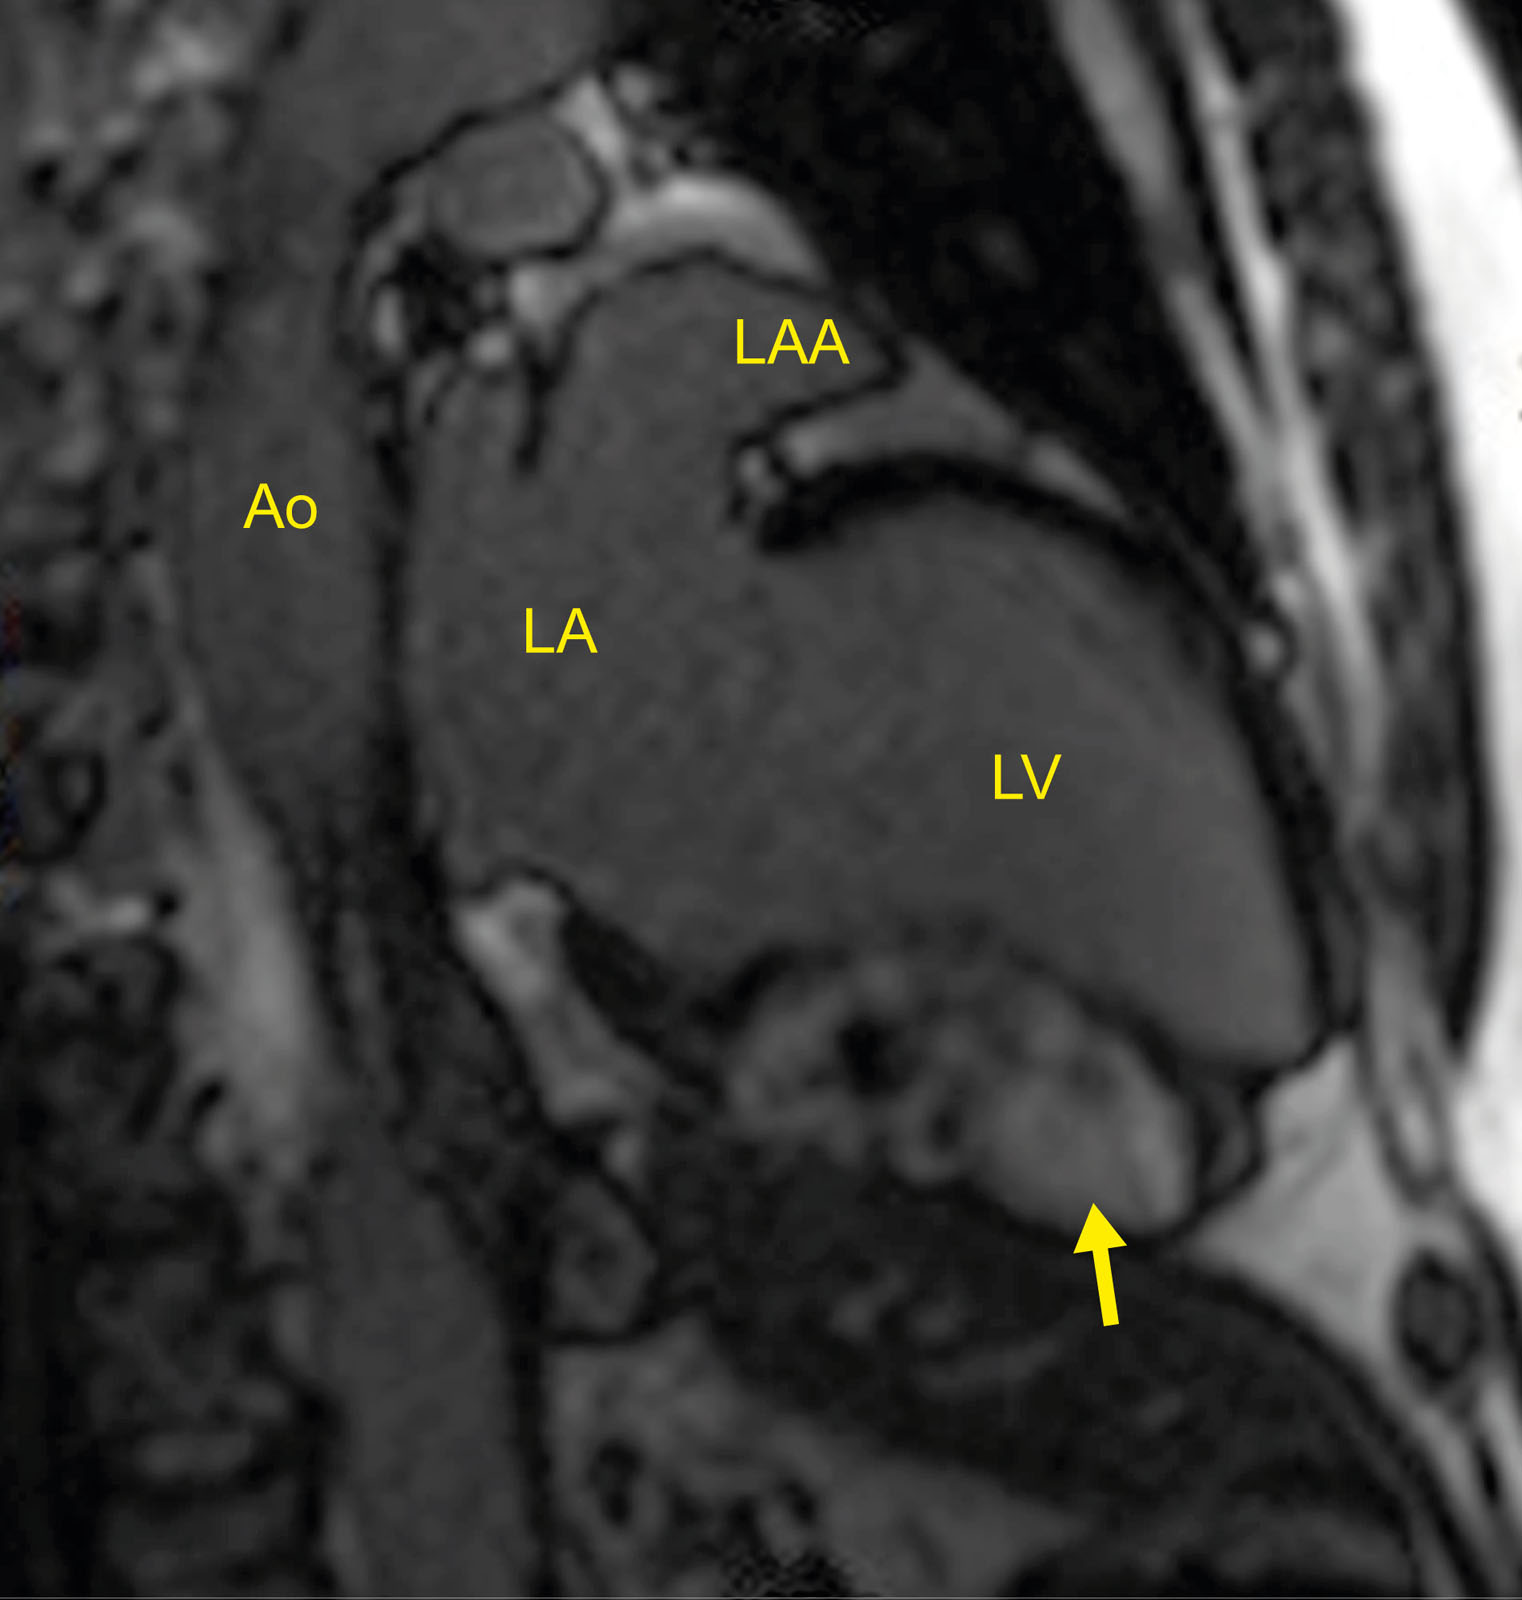
Myocardial fibroma. Sagittal MRI view showing a myocardial fibroma with diffuse late gadolinium enhancement within the inferior LV wall (arrow). Abbreviations: Ao, aorta; LA, left atrium; LAA, left atrial appendage; LV, left ventricular; MRI, magnetic resonance imaging.
eFigure 35.23
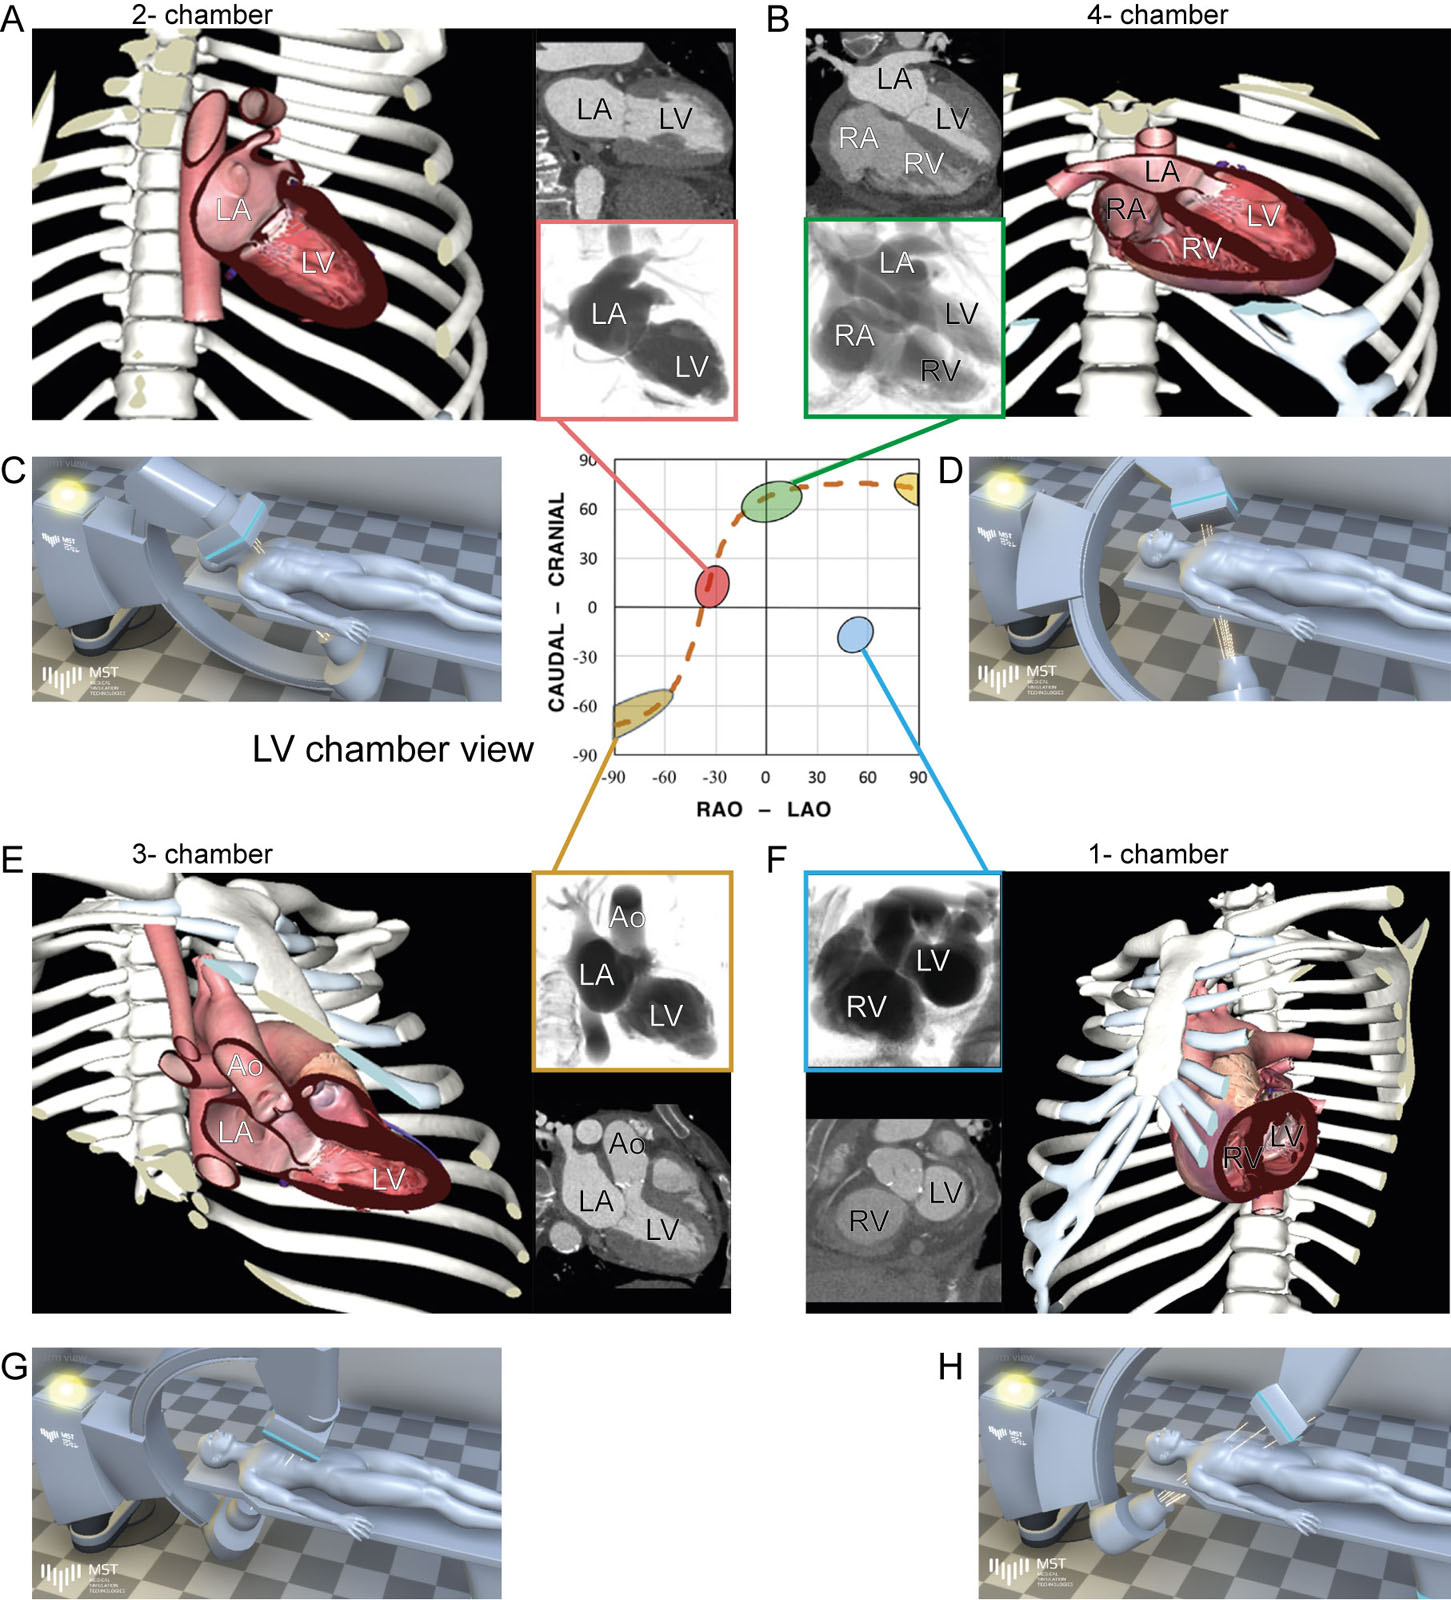
S-curve of the TV annulus showing various LV projections. Fluoroscopic grid integrating LV images, CT chamber view and angiographic chamber views angles from (A) 2C RAO cranial, (B) 4C LAO cranial, (C) 3C RAO caudal and (D) 1C LAO caudal. Abbreviations: 1C, one-chamber; 2C, two-chamber; 3C, three-chamber; 4C, four-chamber; Ao, aorta; CT, computed tomography; LA, left atrium; LAO, left anterior oblique; LV, left ventricular; RA, right atrium; RAO, right anterior oblique RV, right ventricle; TV, tricuspid valve. Adapted from Pighi et al. 54
eFigure 35.24
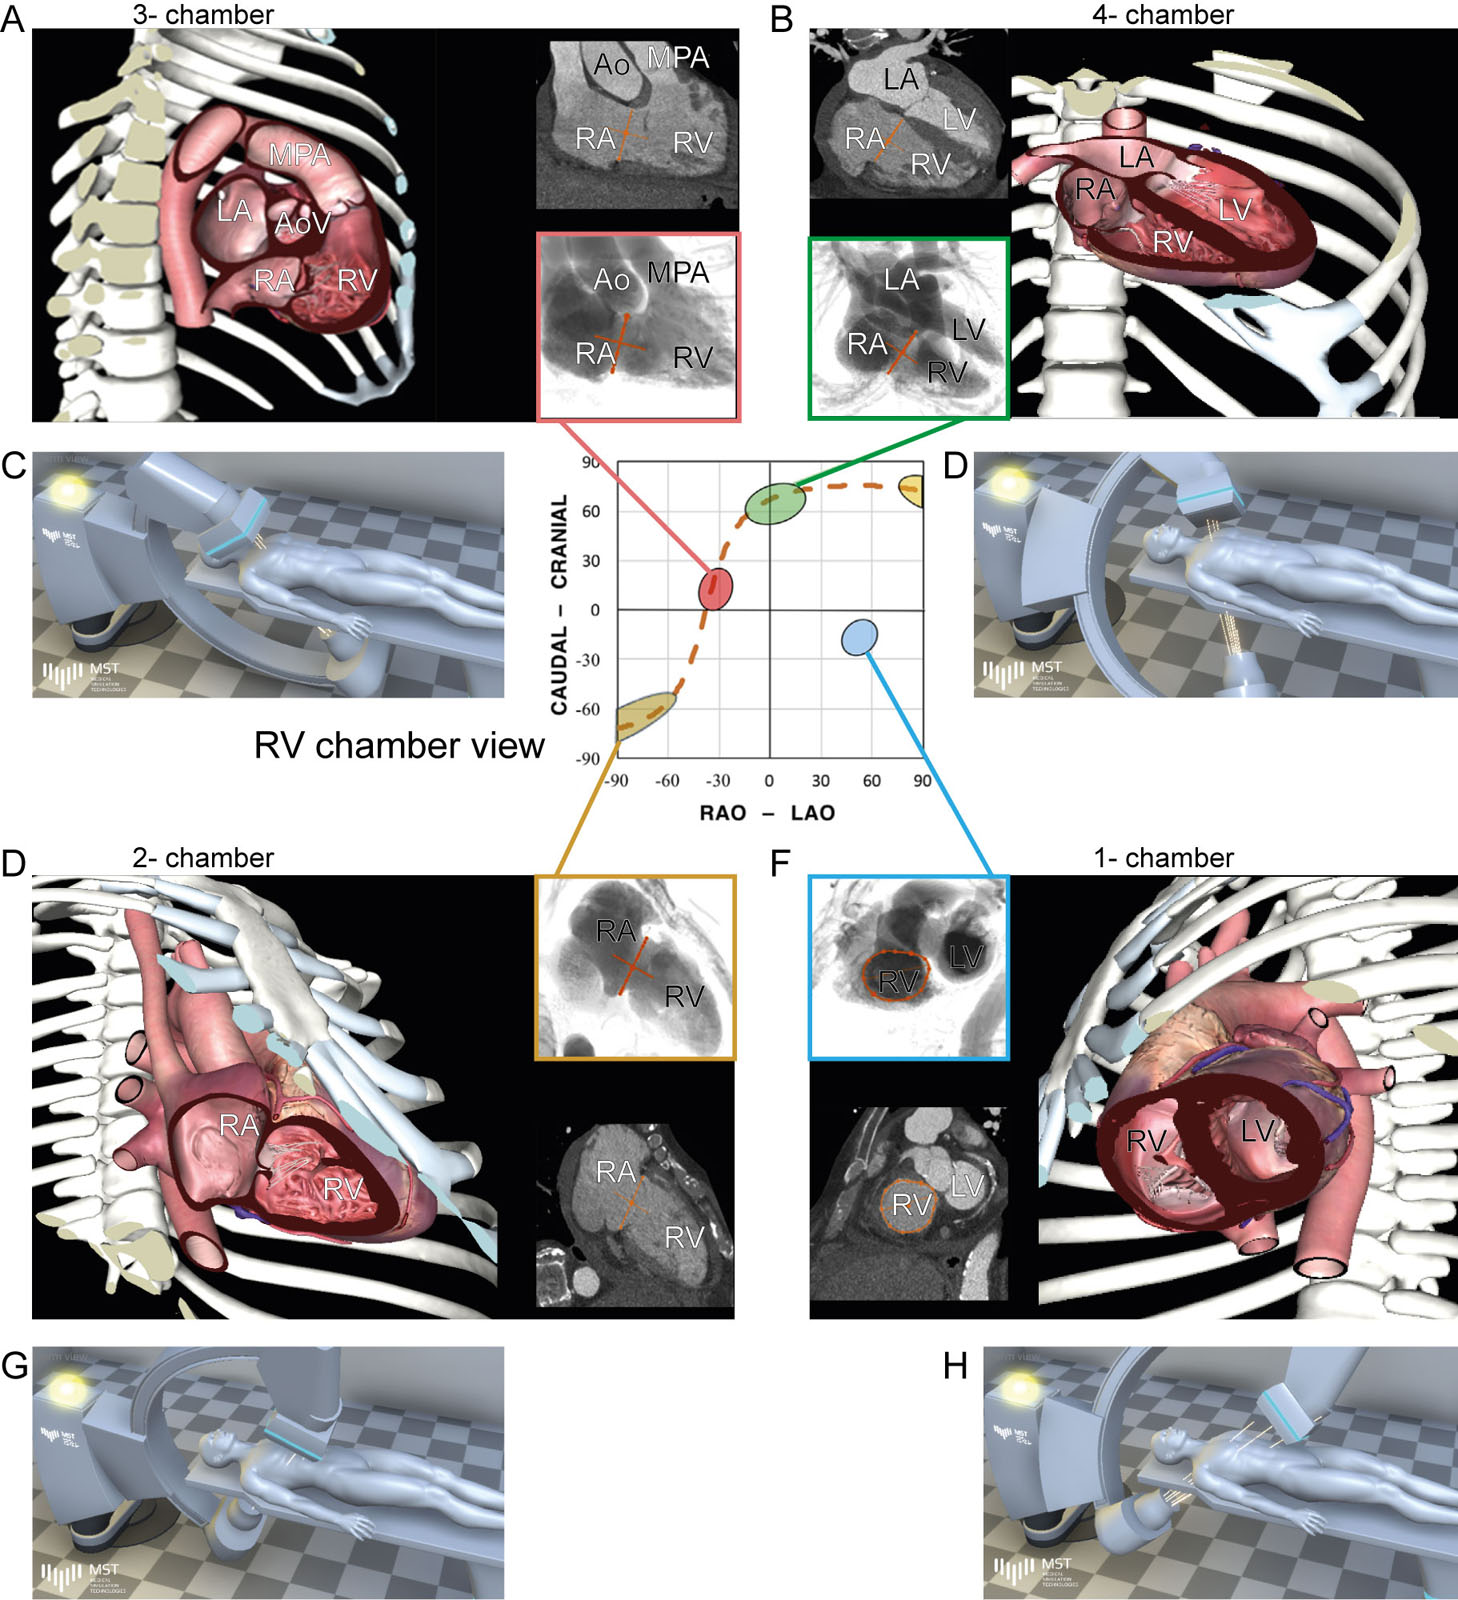
S-curve of the TV annulus showing various RV projections. Fluoroscopic grid integrating RV images, CT chamber views angles and angiographic chamber views angles from (A) 3C RAO cranial, (B) 4C LAO cranial, (C) 2C RAO caudal and (D) 1C LAO caudal. Abbreviations: 1C, one-chamber; 2C, two-chamber; 3C, three-chamber; 4C, four-chamber; Ao, aorta; AoV, aortic valve; CT, computed tomography; LA, left atrium; LAO, left anterior oblique; LV, left ventricular; MPA, main pulmonary artery; RA, right atrium; RAO, right anterior oblique; RV, right ventricle; TV, tricuspid valve. Adapted from Pighi et al. 54
eFigure 35.25
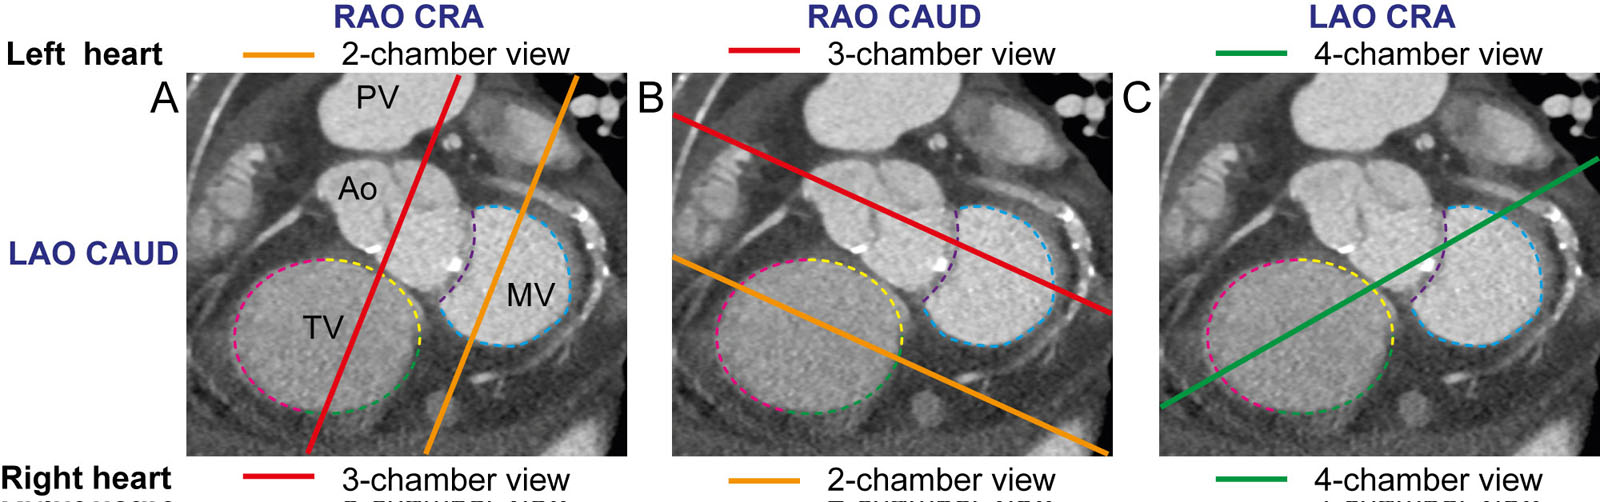
SAX fluoroscopic views of the left and right heart. (A) In RAO cranial, a 2C view is displayed for the left heart but a 3C for the right heart. (B) in RAO caudal, a 3C view is displayed for the left heart but a 2C for the right heart. (C) In LAO cranial, a 4C view displays both left and the right heart.Abbreviations: 2C, two-chamber; 3C, three-chamber; 4C, four-chamber; Ao, aorta; CAUD, caudal; CRA, cranial; LAO, left anterior oblique; MV, mitral valve; PV, pulmonic valve; RAO right anterior oblique; RV, right ventricle; SAX, short-axis; TV, tricuspid valve. Adapted from Pighi et al. 54
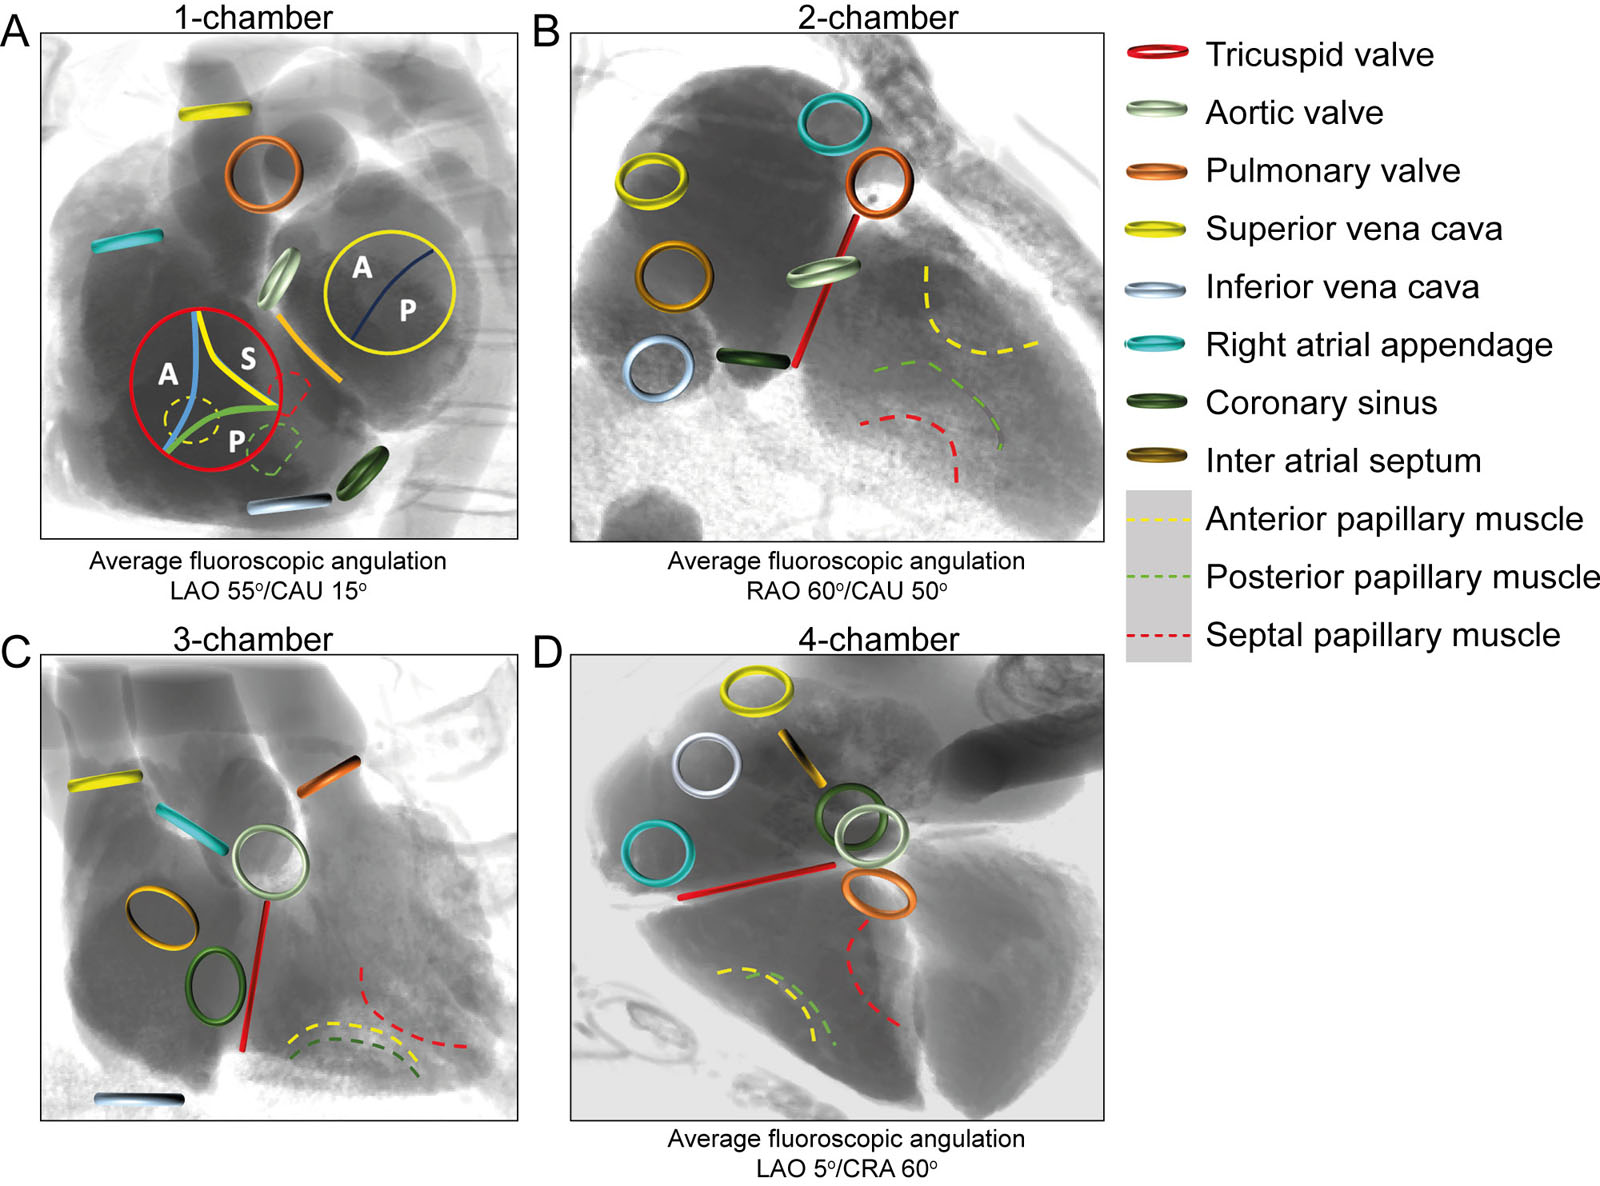
eFigure 35.26
Fluoroscopic RV views with corresponding anatomical structure position from the (A) 1-chamber, (B) 2-chamber, (C) 3-chamber and (D) 4-chamber.Abbreviations: A, anterior; CAUD, caudal; CRA, cranial; LAO, left anterior oblique; P, posterior; RAO, right anterior oblique; S, septal. Courtesy of Dr. Nicolo Piazza.
Videos
Chapter 35 Fig08BC
Chapter 35 Fig23
Chapter 35 Fig25
Tables
eTable 35.1 Classification of radiographic signs of pulmonary edema
Grade |
Left atrial pressure |
Radiographic signs |
I: Vascular redistribution |
12–19 mmHg |
Cephalization of pulmonary vasculature |
II: Interstitial edema |
20–25 mmHg |
Kerley B-lines |
III: Alveolar edema |
>25 mmHg |
Perihilar hazing |
eTable 35.2 Diagnostic comparison of aortic imaging modalities
Parameter |
CT |
MRI |
TTE |
TEE |
Abdo US |
Availability |
+++ |
++ |
+++ |
++ |
+++ |
Portability |
- |
- |
+++ |
+++ |
+++ |
Speed of acquisition |
+++ |
++ |
++ |
++ |
++ |
Spatial resolution |
+++ |
++ |
++ |
+++ |
++ |
Temporal resolution |
+ |
++ |
+++ |
+++ |
+++ |
3D data set |
+++ |
++ |
+ |
++ |
+ |
Arch branch vessel evaluation |
+++ |
+++ |
++ |
+ |
NA |
Evaluation of valve and ventricular function |
+ |
++ |
+++ |
+++ |
NA |
Abbreviations: 3D, three-dimensional; Abdo, abdominal; CT, computed tomography; MRI, magnetic resonance; NA, not available; TEE, transesophageal echocardiography; TTE, transthoracic echocardiography; US, ultrasound. Adapted from Isselbacher 55 |
|||||
eTable 35.3 Comparison of diagnostic modalities
|
Transesophageal Echocardiography (TEE) |
Chest Radiography |
Computed Tomography (CT) |
Magnetic Resonance Imaging |
General |
Real-time acquisition |
Difficult to interpret |
Short scanning time |
Long scanning time |
Functional studies |
Most commonly used |
Poor (except acute edema) |
Fairly accurate |
Accurate |
Valves |
Anatomy |
Severe calcifications |
Finer anatomic detail |
Finer anatomic detail |
Endocarditis |
Most commonly used |
– |
Perivalvular extent |
– |
Coronary arteries |
– |
Very severe calcifications |
Non-invasive |
Non-invasive |
Myocardium |
Thickness |
Ventricular and atrial enlargement |
Thickness |
Thickness |
Pericardium |
Quantification of pericardial effusion |
Severe calcifications |
Calcifications |
Quantification and qualification of pericardial effusion |
Tumors |
Limited tumor extension |
– |
Detailed tumor extension |
Detailed tumor extension |
Extra-cardiac structures |
Limited evaluation |
Extra-cardiac repercussion of cardiac diseases (pulmonary edema) |
Extra-cardiac repercussion of cardiac diseases (pulmonary edema) |
Limited evaluation |