Figures
eFigure 7.2
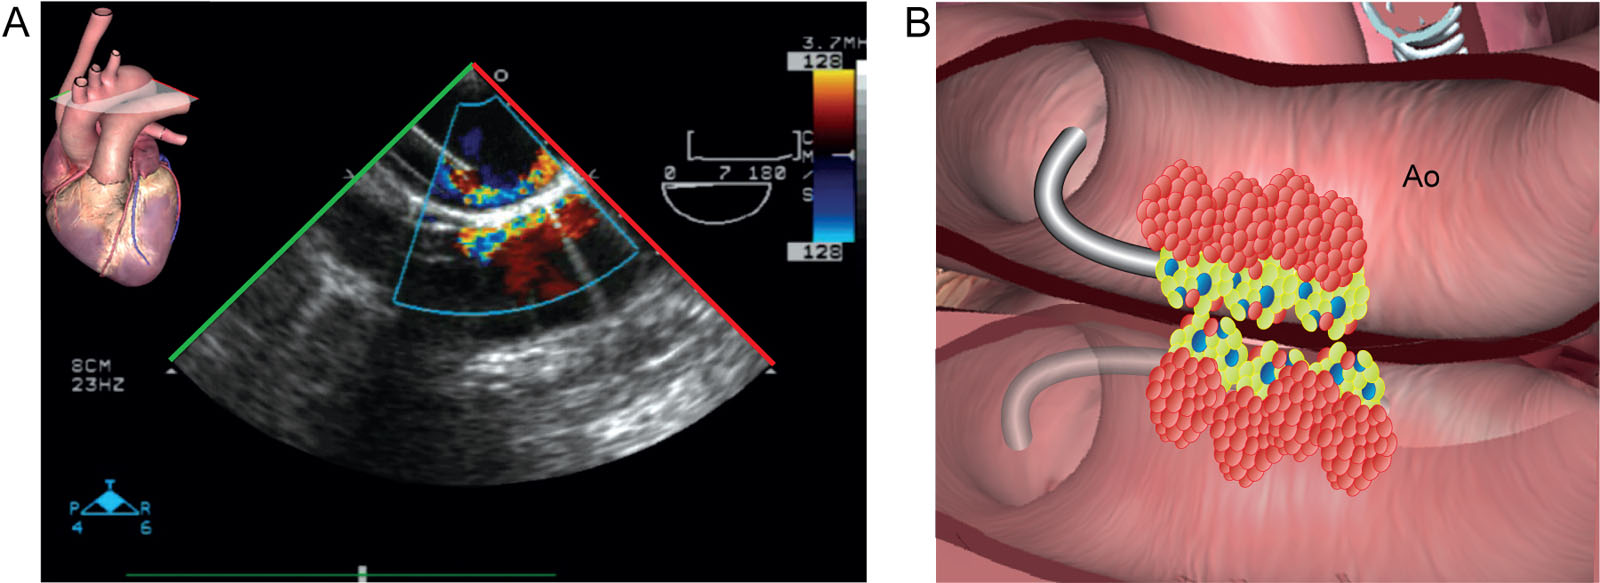
Reverberation. (A, B) This UE aortic arch LAX view at 7° shows reverberation artifacts in both 2D and CFI of the aorta and the aortic cannula. Abbreviations: 2D, two-dimensional; Ao, aorta; CFI, color flow imaging; LAX, long-axis; UE, upper-esophageal.
eFigure 7.8
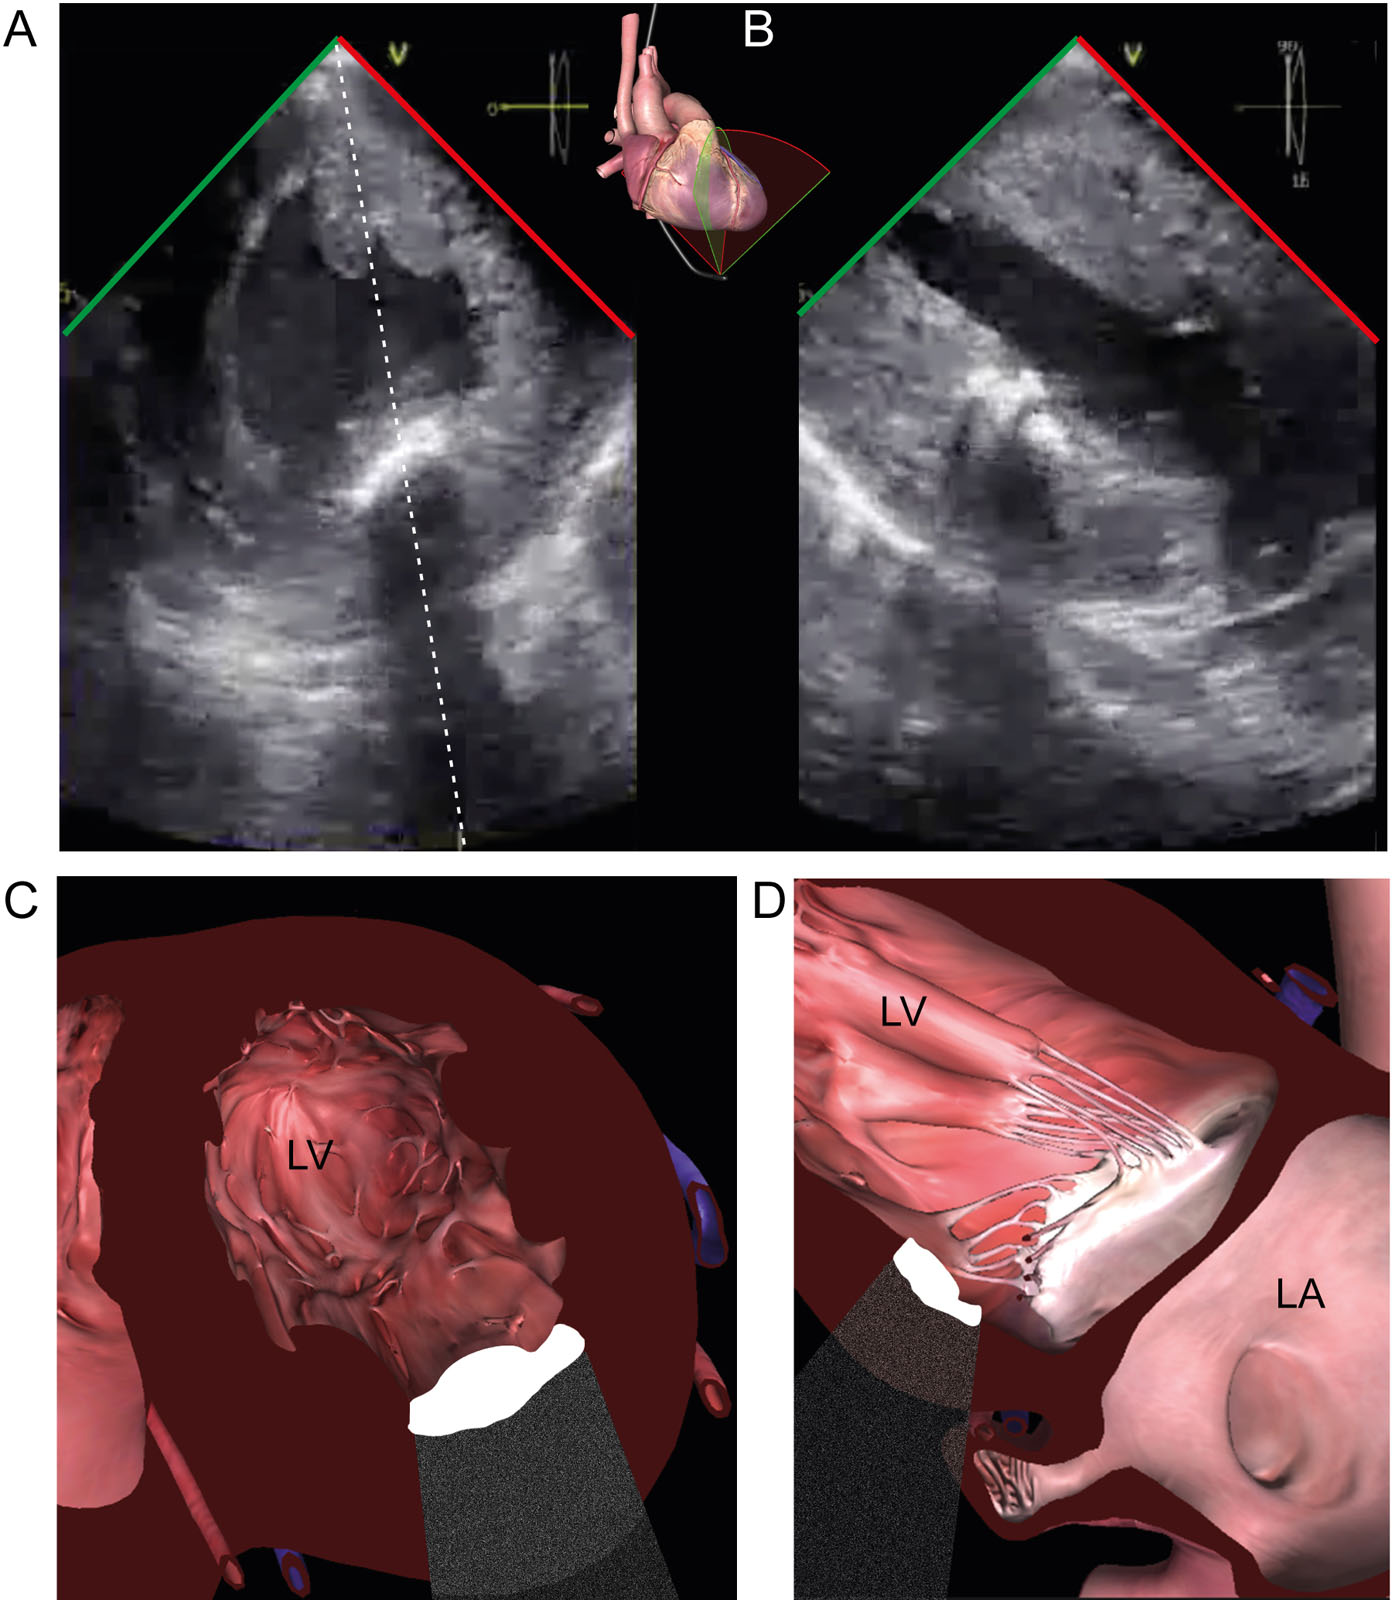
Acoustic shadowing. (A, B) This TG biplane view of the LV shows a calcified antero-lateral papillary muscle which causes acoustic shadowing obscuring the far field in both views. Abbreviations: LA, left atrium; LV, left ventricle; TG, transgastric.
eFigure 7.15
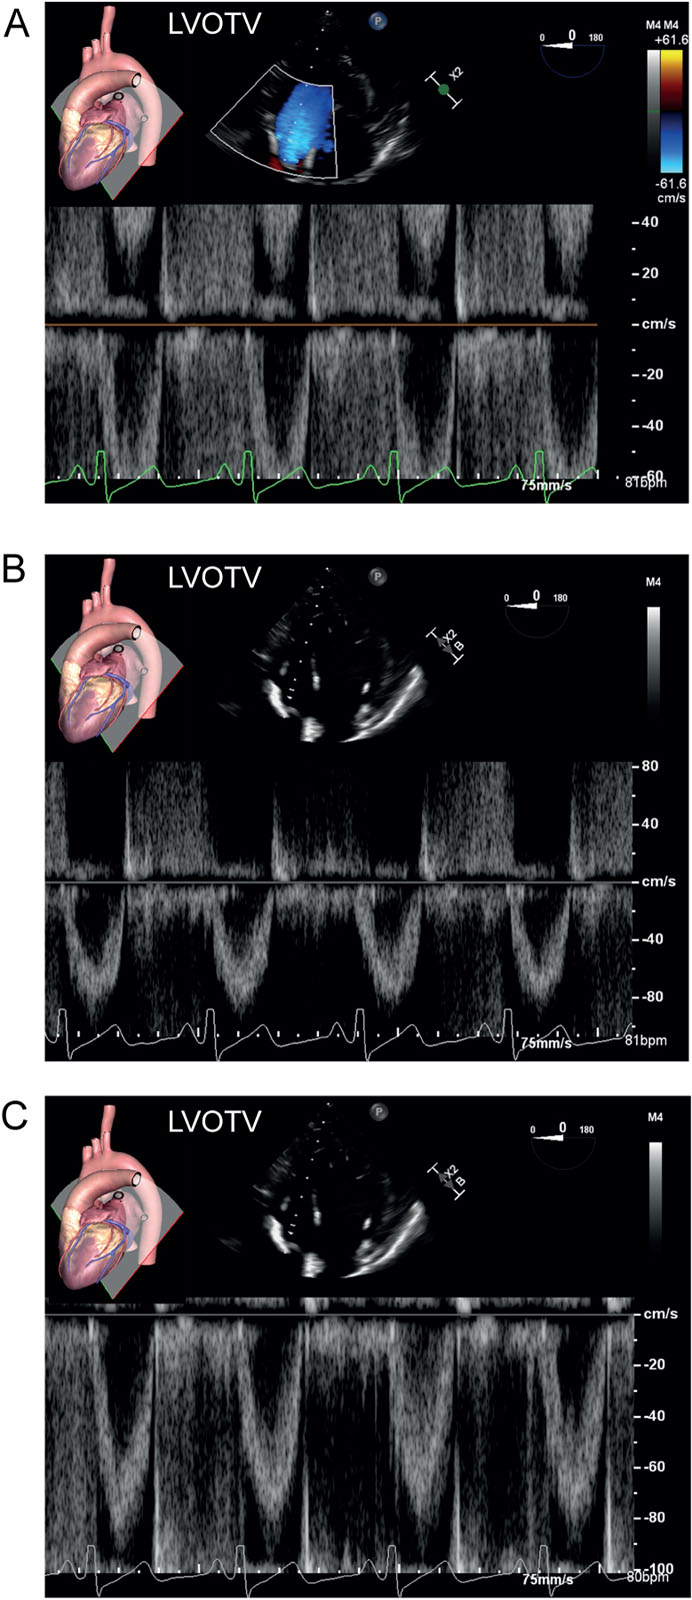
Spectral Doppler aliasing. (A-C) These are PWD signals of the LVOT from a DTG view. (A) The peak negative LVOT velocity (<0 cm/s or baseline) exceeds the upper limit of the velocity scale, and a simultaneous aliasing signal appears on the opposite side of the baseline at the top of the display. (B) Altering the scale peak velocity from –60 to –110 cm/s or (C) shifting the baseline up to a maximum velocity of –100 cm/s eliminates the aliasing artifact. Abbreviations: DTG, deep transgastric; LVOT, left ventricular outflow tract; LVOTV, left ventricular outflow tract velocity; PWD, pulsed-wave Doppler.
eFigure 7.16
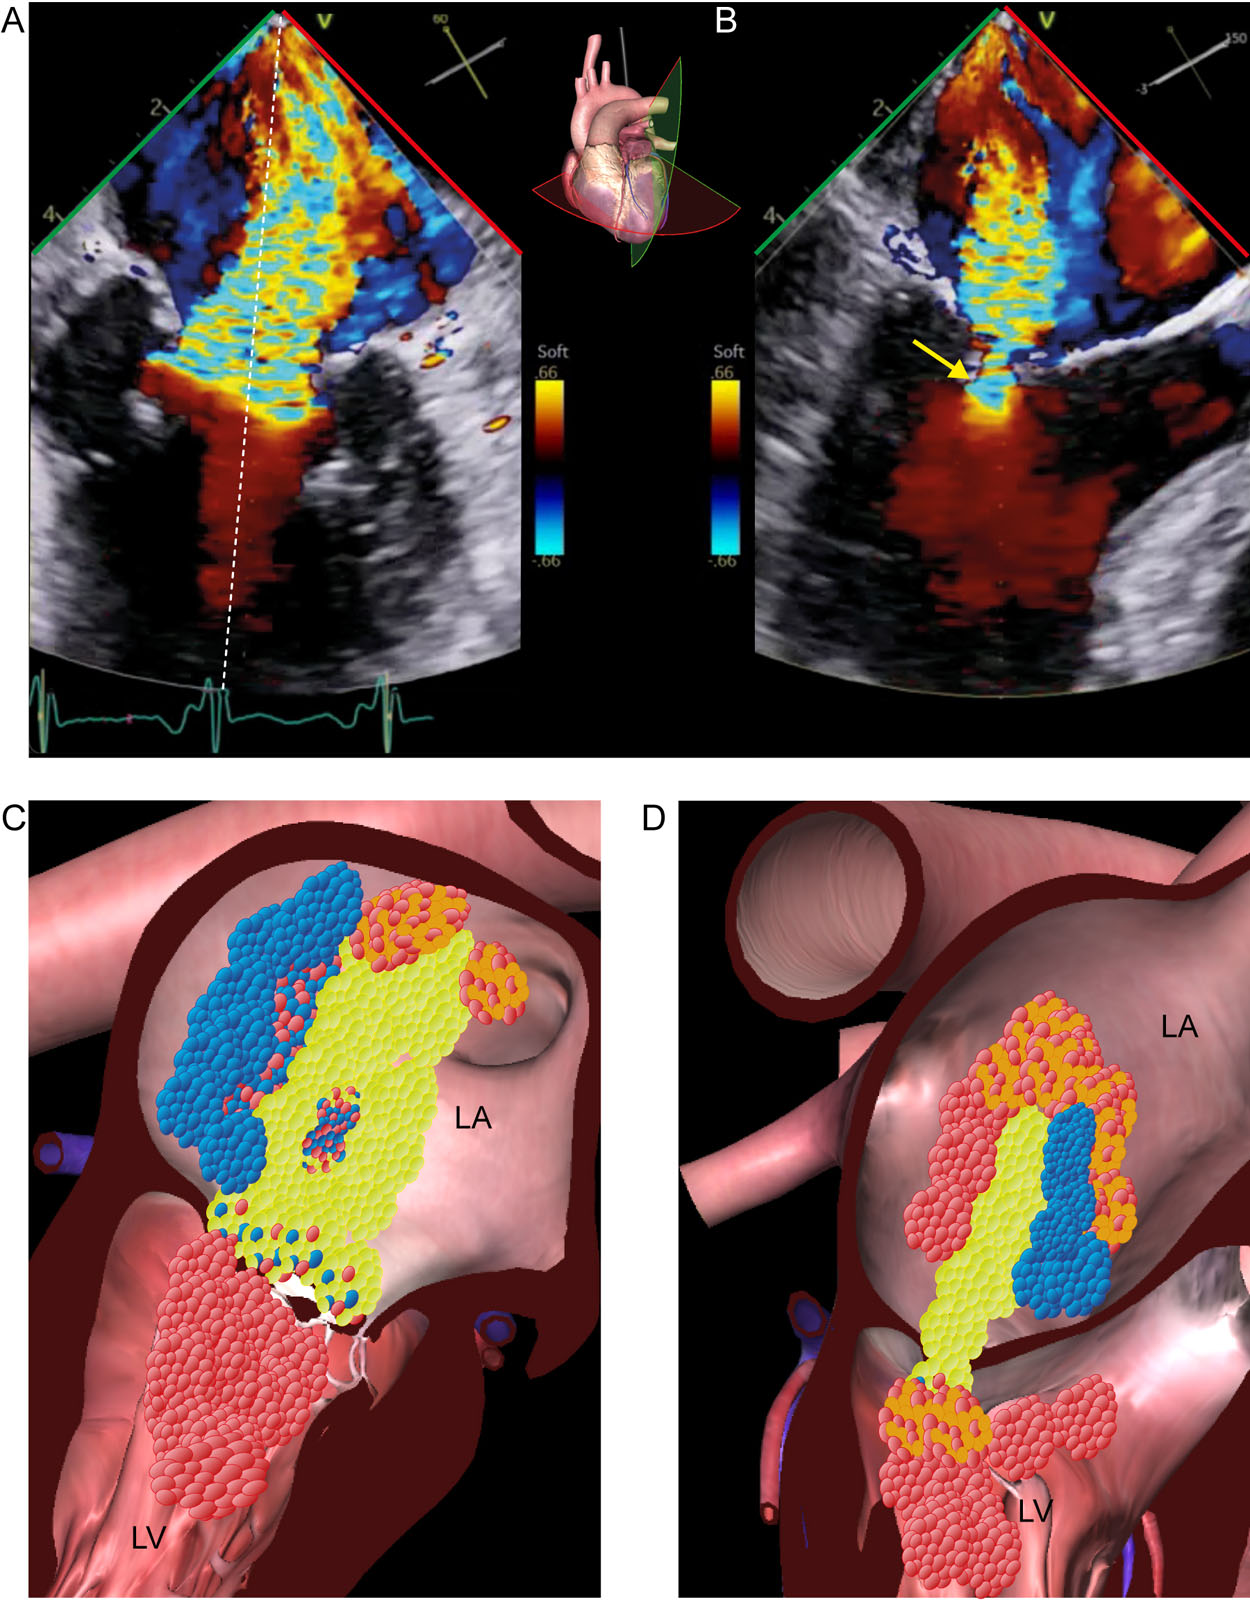
Color Doppler aliasing. (A-D) This is a ME MC biplane view with CFI of the MV. CFI shows mitral regurgitation with blood flow acceleration as aliasing in the LV below the MV. Aliasing appears as an abrupt change in color from red to yellow to light blue (arrow) as velocities exceed the upper limit of the velocity scale. The blue suggest blood flow is going in the opposite direction even when it is still going from LV to LA. Abbreviations: CFI, color flow imaging; LA, left atrium; LV, left ventricle; MC, mitral commissural; ME, mid-esophageal; MV, mitral valve.
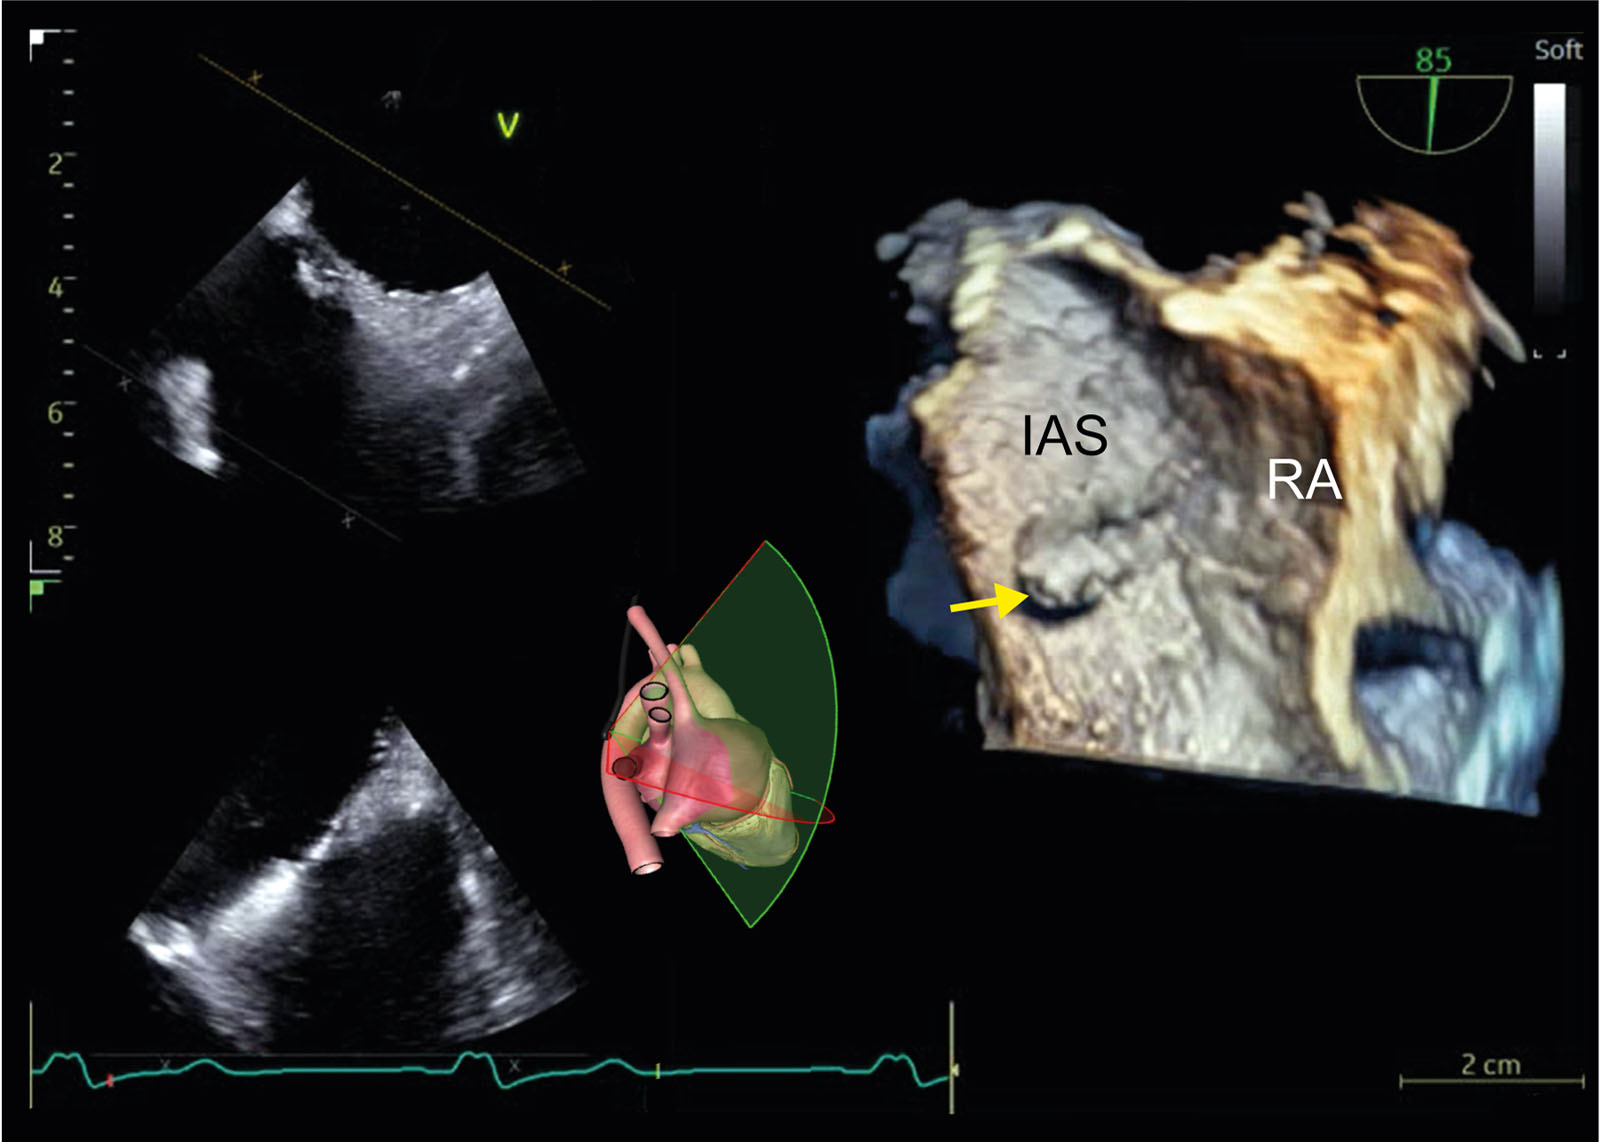
eFigure 7.21
Dropout. These are ME biplane and 3D views of the IAS in a single display. There is a false appearance of tissue deficiency in the fossa ovalis (arrow) because of dropout artifact in the 3D image from the RA perspective. When the structure alignment is not completely perpendicular to the US beam, some reflected echo signals reflect away from the transducer, resulting in the loss of image. Abbreviations: 3D, three-dimensional; IAS, interatrial septum; ME, mid-esophageal; RA, right atrium; US, ultrasound.
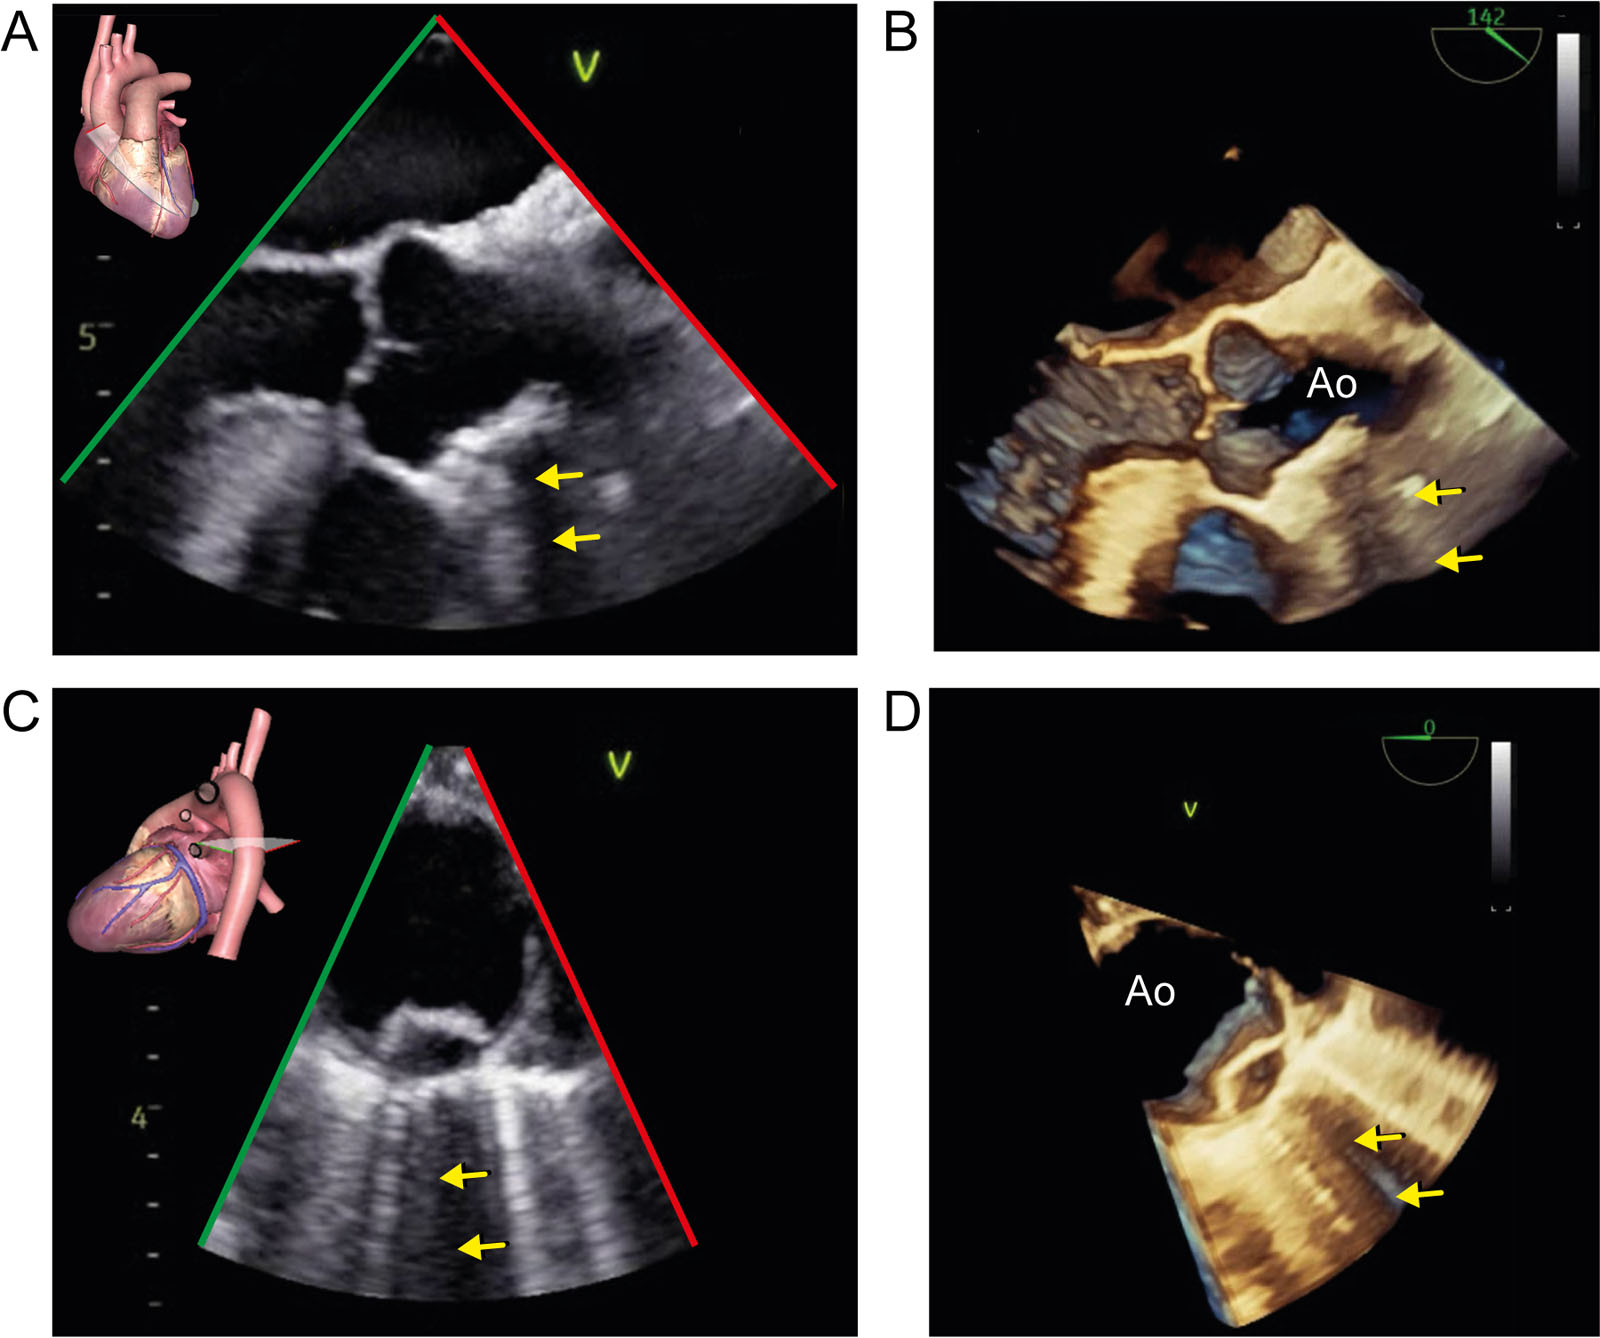
eFigure 7.27
Acoustic Shadowing. (A, B) These 2D and 3D ME AoV LAX views show a large calcified atheromatous plaque from the sinus tubular junction into the ascending aorta causing acoustic shadowing (arrow) in both images. (C, D) These 2D and 3D ME SAX views of the descending thoracic aorta show an atheromatous plaque in the descending thoracic aorta, also causing acoustic shadowing (arrows) in both images. Note also the ring-down or B lines in the lung on both sides of the acoustic shadowing. Abbreviations: 2D, two-dimensional; 3D, three-dimensional; Ao, aorta; AoV, aortic valve LAX, long-axis; ME, mid-esophageal; SAX, short-axis.
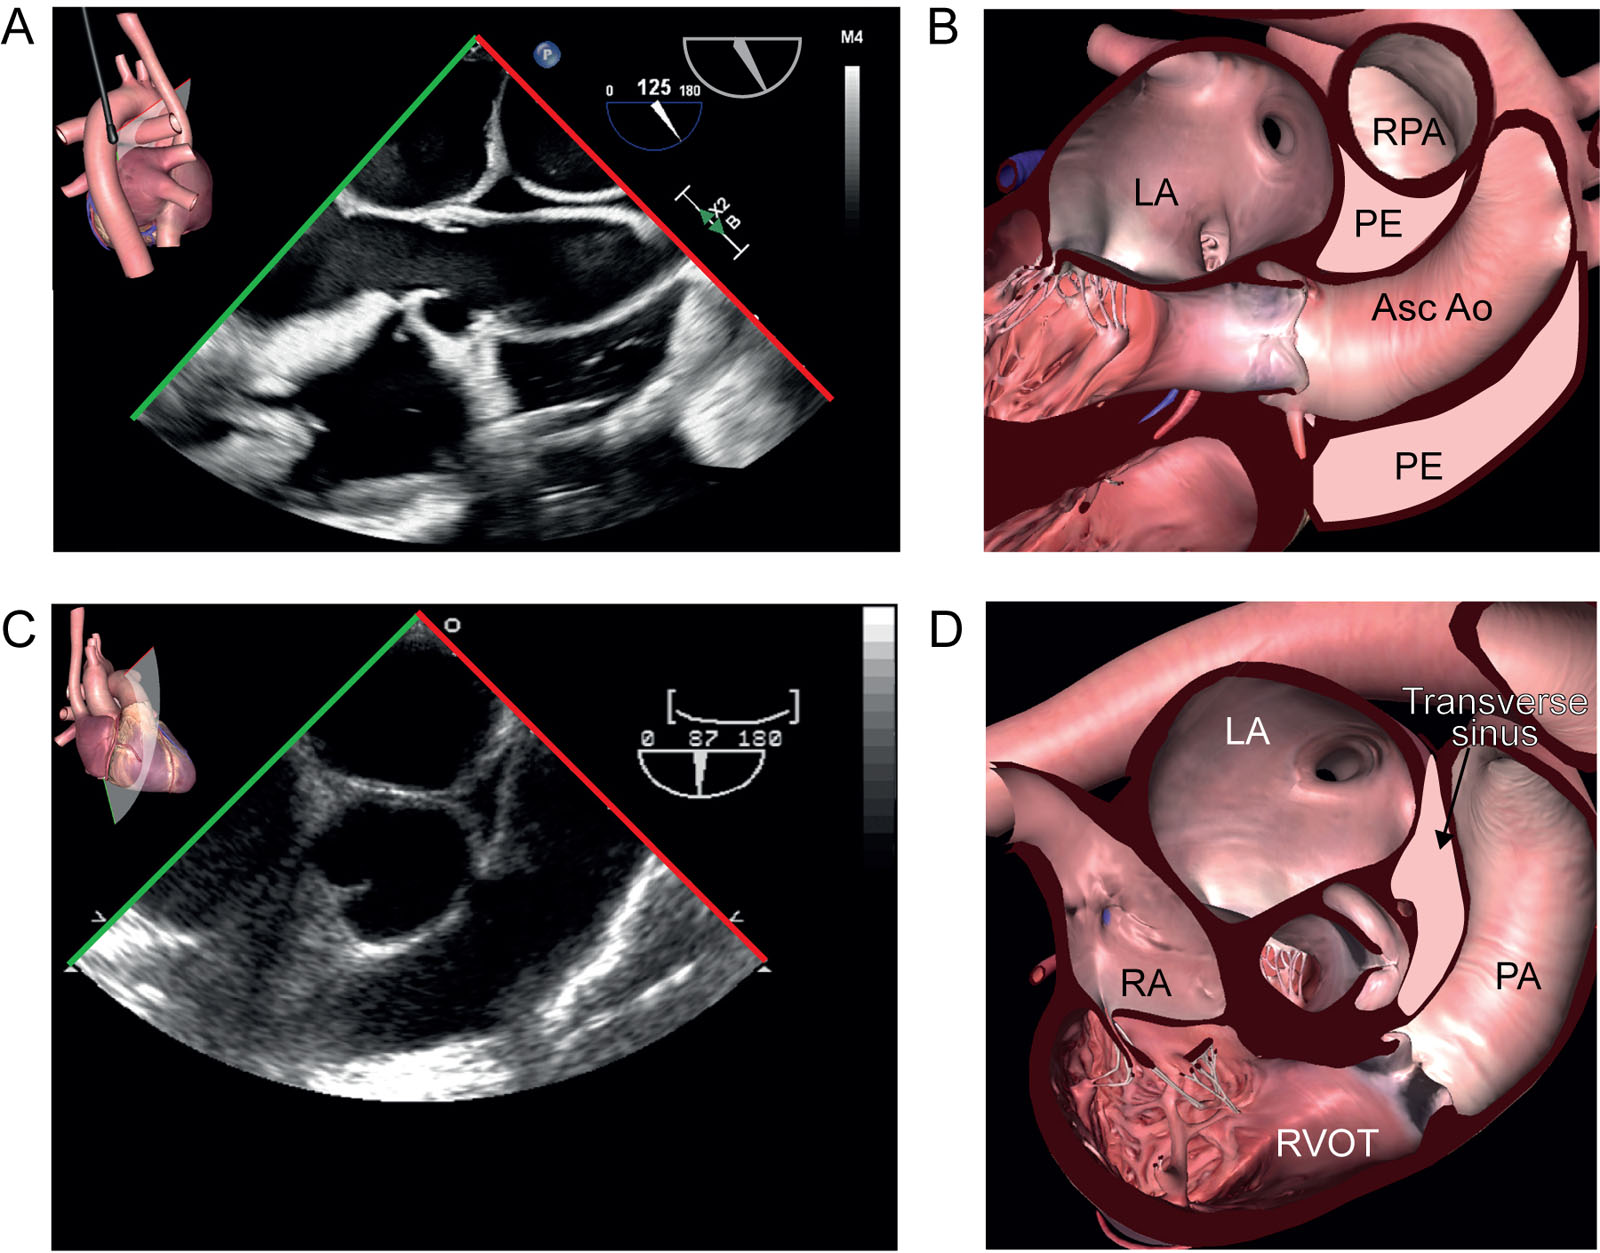
eFigure 7.43
Transverse pericardial sinus. (A, B) The transverse pericardial sinus in this ME ascending Ao LAX view at 120° appears as a small triangular echo-free space between the ascending Ao and RPA. (C, D) This ME RV inflow/outflow view shows the transverse sinus just beside the Ao. Abbreviations: Ao, aorta; Asc, ascending; LA, left atrium; LAX, long-axis; ME, mid-esophageal; PA, pulmonary artery; PE, pericardial effusions; RA, right atrium; RPA, right pulmonary artery; RV, right ventricle; RVOT, right ventricular outflow tract.
Videos
Chapter 07 Fig01A
Chapter 07 Fig02A
Chapter 07 Fig03AB
Chapter 07 Fig04ABC
Chapter 07 Fig05A
Chapter 07 Fig05C
Chapter 07 Fig06A
Chapter 07 Fig07A
Chapter 07 Fig08AB
Chapter 07 Fig09A
Chapter 07 Fig10A
Chapter 07 Fig13AC
Chapter 07 Fig13E
Chapter 07 Fig14A
Chapter 07 Fig14B
Chapter 07 Fig16AB
Chapter 07 Fig18A
Chapter 07 Fig19A
Chapter 07 Fig20A
Chapter 07 Fig21
Chapter 07 Fig22
Chapter 07 Fig23A
Chapter 07 Fig23B
Chapter 07 Fig24A
Chapter 07 Fig24B
Chapter 07 Fig25A
Chapter 07 Fig25C
Chapter 07 Fig25D
Chapter 07 Fig26A
Chapter 07 Fig26B
Chapter 07 Fig26C
Chapter 07 Fig26D
Chapter 07 Fig27AB
Chapter 07 Fig27CD
Chapter 07 Fig28AB
Chapter 07 Fig28E
Chapter 07 Fig28F
Chapter 07 Fig29A
Chapter 07 Fig29C
Chapter 07 Fig29D
Chapter 07 Fig30A
Chapter 07 Fig30C
Chapter 07 Fig30E
Chapter 07 Fig31A
Chapter 07 Fig32A
Chapter 07 Fig32E
Chapter 07 Fig33A
Chapter 07 Fig33C
Chapter 07 Fig33I
Chapter 07 Fig34A
Chapter 07 Fig35A
Chapter 07 Fig35C
Chapter 07 Fig36A
Chapter 07 Fig36C
Chapter 07 Fig36E
Chapter 07 Fig37A
Chapter 07 Fig38C
Chapter 07 Fig38D
Chapter 07 Fig38F
Chapter 07 Fig39A
Chapter 07 Fig39C
Chapter 07 Fig40A
Chapter 07 Fig41A
Chapter 07 Fig41CD
Chapter 07 Fig42A
Chapter 07 Fig42B
Chapter 07 Fig43A
Chapter 07 Fig43C
Chapter 07 Fig44A
Chapter 07 Fig44C
Tables
eTable 7.1 Overview of echocardiographic artifacts
| 1) US assumption violation1 | ||
1A: Axial or depth direction (artifact below the actual structure) |
||
|
Characteristics features |
How to avoid |
Reverberation |
|
|
Ring-down |
|
|
Mirror-image artifacts |
|
|
Acoustic shadowing |
|
|
Acoustic enhancement |
|
|
1B: Lateral direction (artifact located to the side of the actual structure) |
||
Refraction artifacts |
|
|
Beam width artifacts |
|
|
Side lobe artifacts |
|
|
2) Interference by external equipment and devices |
||
2A: External equipment |
||
Unshielded electrical equip |
|
|
Aliasing |
|
|
Click |
|
|
Quadrature-Channel Cross Talk |
|
|
2D-Devices |
||
US interference |
|
|
Near-field clutter |
|
|
VAD |
|
|
3) 3D artifacts |
||
Stitching |
|
|
Dropout |
|
|
Blurring |
|
|
Blooming |
|
|
Railroad-shaped |
|
|
Reverberation |
component of catheters may appear to lengthen the catheter |
|
Shadowing |
|
|
Gain |
|
|
1US system assumptions are: |
||
Abbreviations: 2D, two-dimensional; 3D, three-dimensional; CFI, color flow imaging; CMR, cardiac magnetic resonance; CT, computed tomography; CWD, continuous-wave Doppler; ICE intracardiac echocardiography; PWD pulsed-wave Doppler; |
||