Chapter 1
Flashcards
Quiz
Chapter 2
Case study
CASE STUDY: Does colour constancy exist?
DownloadColour constancy concerns our ability to detect the colour of an object despite changes in illumination. For example, when looking at the sea on your morning stroll along the beach, you see it as blue, and it seems the same at sunset. The light reflected from the sea that enters the eye has a different wavelength at sunset, yet we perceive the colour to be the same. Examples like this led us to believe that a mechanism in the visual system carries out calculations on the surface colour of objects so that we are able to perceive an object’s single colour in different lighting conditions. However, Foster (2003) questions the evidence for this assertion, arguing that it remains unproven that such a mechanism exists.
Many psychologists assume that colour constancy is a basic feature of visual processing systems, especially since it is associated with biological importance, such as being able to detect ripe from unripe fruit. Colour constancy allows for a stable visual world.
Colour perception depends on the reception of the wavelengths of light being reflected from an object. However, the wavelength entering the eye is a combination of the colour of the light and the properties of the object itself – thus, “a red paper in white light can look the same as a white paper in red light” (Foster, 2003, p. 1). The task of the visual system is to calculate the colour of the object by controlling for, or eliminating, the colour of the light. When several different coloured objects are present this task may be easier since it is easier to eliminate the colour of the light, given cues from more than one object. This is the basis of Land’s retinex colour-constancy schemes. However, measuring perceived colour may not be without its problems.
One method is colour naming, in which participants are required to select a colour name to refer to the colour perceived. It is then possible to record responses to a number of objects in different illuminations. One problem is that this is not very accurate as a method of measurement: participants often use the same colour name (e.g., blue) for different shades (of blue), even when the illumination is constant. It has been estimated that there are more than 2 million distinctly perceivable colours, and this far exceeds the number of colour names that people are willing to use.
A second method is to get participants to match two colours by adjusting the red, green and blue of the second colour using colour controls. So, the same coloured surface is presented under different illuminations and the participant adjusts the colour of the second surface to match the first “as if it were ‘cut from the same piece of paper’” (Foster, 2003, p. 2). Under this method and with computer-simulated scenes, colour matching can be as accurate as 79% to 87%. The problem with this method is that it only guarantees matching two items as equivalent, it does not measure perceived colour. This is because participants need merely to judge how the colour of one surface relates to the colour of one or more other surfaces, and hence this method does not measure colour constancy.
A third method involves participants adjusting the colour of a surface within a scene so that it appears white (achromatic adjustment). The method records their perception of the colour of the illuminant, since that is what they are attempting to adjust for. Performance can reach up to 83% of the real unbiased colour (white). However, although this has been used to measure colour constancy, Foster argues that it cannot do so, because in order to complete the task participants can make use of the hue of surrounding colours in the scene. In order to achieve colour constancy, the illuminant needs to be identified – however, judgements based on relative brightness say nothing about the nature of the illuminant.
Judgements of colour can be based on numerous sources of information. One common assumption is that the object with the brightest surface is white, and once this is made other colours are perceived relative to that surface. However, there are many other ways, and the fact that many other ways are used implies that there may not be a single mechanism that calculates colour constancy.
Because of the limitations in measuring perceived colour, psychologists have no way of knowing whether true colour constancy exists.
Reference
Foster, D.H. (2003). Does colour constancy exist? Trends in Cognitive Sciences, 7(10), 439–443.
Flashcards
Quiz
Chapter 3
Case studies
CASE STUDY: Bruce and Young’s (1986) model of face processing
Vuilleumier et al. (2005): Effects of perceived mutual gaze and gender on face processing and recognition memory
DownloadBruce and Young (1986) described a model of face processing in which different aspects of face processing are carried out independently. This modular theory has been questioned in the literature, although there is supporting evidence for a number of these independent processes. The study by Vuilleumier et al. (2005) attempts to examine the effects of an individual’s gaze on the ability to identify features of the face, such as the person’s sex, and on the ability to recognise the face afterwards.
The two main routes in the Bruce and Young model are processing an individual face for identity recognition (knowing who they are) and processing facial expression and features such as the sex, age and race of the face. If the two routes are independent, then it should be possible to achieve one type of processing and fail at the other. This has been found with prosopagnosic patients, who can recognise the emotions in a face but not the identity of the face itself. Also, patients impaired at recognising an expression have been found to be able to recognise the face itself.
One important finding of Vuilleumier et al.’s (2005) study is that recognition of a set of new faces is influenced by facial expressiveness (the direction of gaze) and by features such as the sex of the face. This finding implies that the two routes are not completely independent and there is likely to be a good deal of interaction in processing between the two routes.
Perceived gaze is an interesting subject to study since it can convey important social information, such as the intentions and interests of others. These can further imply that an encounter is likely, and whether it might be positive (e.g., attraction) or negative (e.g., threat). Gender judgement is also something that individuals do rapidly and with a good deal of accuracy, even when cues such as facial hair, make-up and so on are removed from the decision process.
In the Vuilleumier et al. (2005) study there were two tasks. The participant was shown a number of faces and had to decide, by pressing one of two keys, whether the face was a man or a woman. The second task was a recognition task, in which the participant had to say whether each face was one of those used in the first task or not. The faces were presented either face-on or to the side, and with eyes looking at the viewer or looking away.
The results showed that the direction of gaze significantly affected the judgement of the sex of the face. Participants were quicker when the eyes were averted than when they were looking at the viewer. Also, of interest was that this effect was especially so when the face was of the opposite sex to the participant. The results of the recognition task show that it was easier for faces looking directly at the viewer than for side-on faces and when the gaze was averted, and also especially for the opposite sex.
The conclusion is that perceived eye contact can interact with face processing and face recognition, even when gaze direction is not relevant to the task.
References
Bruce, V., & Young, A.W. (1986). Understanding face recognition. British Journal of Psychology, 77: 305–327.
Vuilleumier, P., George, N., Lister, V., Armony, J. & Driver, J. (2005). Effects of perceived mutual gaze and gender on face processing and recognition memory. Visual Cognition, 12 (1): 85–101.
CASE STUDY: Bruce and Young’s (1986) model of face processing
Armann et al. (2015): A familiarity disadvantage for remembering specific images of faces
DownloadBruce and Young’s (1986) model of face processing takes the view that aspects of facial processing are somewhat independent. However, there is a growing body of research to suggest that this might not be the case. The study by Armann, Jenkins and Burton (2015) aimed to test the assumption that unfamiliar face processing is image-bound, in contrast to abstractive familiar face processing.
Pictorial information dominates one’s representation for an unfamiliar face, making it easy to recognise when a specific image has been seen before. However, when we see a familiar face, familiarity information (personal information), will automatically be generated. This occurs at the expense of pictorial information. For example, participants might find themselves thinking “Yes, I know I saw President Trump before, but I’m not sure if I saw that particular photo of him”.
In previous recognition memory experiments of faces, the recognition phase often confounds the recognition of the photo and the person. In many of these experiments, the same photo is used at the learning and test phases. One important finding of Armann et al.’s (2015) study is that viewers are more accurate when remembering that they saw “this person” rather than “this picture”, when the face is familiar.
In Armann et al.’s (2015) study, there were two experiments. In the first experiment, participants were presented with a memory task whereby they were shown a set of faces during the study phase and were instructed to remember the people shown. In the recognition phase (test phase), participants were shown a further set of faces. For each image, half the participants were asked, “did you see this person before?”and the other group were asked, “did you see this exact picture before?”. Everything was the same for the second experiment, however, one difference was that participants were required to remember the exact image during the study phase.
Results from the first experiment aligned with previous literature, concluding that people are better at recognising familiar rather unfamiliar faces. However, the researchers concluded that when the memory task is image-specific, individuals are at a disadvantage when recognising familiar faces. This would suggest that coding of familiar faces is less reliant on image-specific properties than coding of unfamiliar faces. Furthermore, when presented with the same picture test item, results inferred an advantage for unfamiliar faces in the picture task (second experiment).
The key differences between familiar and unfamiliar face-recognition memory are unaffected by instruction: unfamiliar faces are encoded more pictorially and familiar faces more abstractly, regardless of instruction. Therefore, the researchers concluded that we rely on more abstract representations for familiar than unfamiliar faces, which results in poorer coding of pictorial information in images of people we know.
References
Armann, R.G.M., Jenkins, R. & Burton, A.M. (2016). A familiarity disadvantage for remembering specific images of faces. Journal of Experimental Psychology: Human Perception and Performance, 42 (4), 571–580.
Bruce, V. & Young, A.W. (1986). Understanding face recognition. British Journal of Psychology, 77: 305–327.
Research activity
RESEARCH ACTIVITY: Mental imagery
DownloadAccording to Kosslyn (1980, 1994), the mechanisms used to generate mental images are the same as those used in visual perception. The main difference between visual perception and mental imagery is the amount of detail in vision. Another difference is that we know that mental images are often created deliberately. If mental images do indeed operate in the same way as visual images, then one should expect that an imagined task should take about the same time as the task itself when carried out.
The tasks
First, think about the garden in the place where you live (or someone else’s that you know very well). Measure the time it takes to imagine walking from one end of the garden to the other. Don’t run or speed up the task but imagine yourself walking at a normal steady pace.
Next, think of an open space you know quite well, such as a local playing field. Measure the time it takes to imagine yourself walking in this field for about the same distance as you “walked” in the first task. Use one landmark in the field as the signal that you have covered the same distance as in the first task.
The third task is to measure the actual time it takes you to (physically) walk the length of the garden and back, and the fourth task is to measure the time it takes for you to walk the same distance in the field.
You should have four measurements. We will call them:
- Garden Imagery – the time taken for an imaginary walk down the garden.
- Garden Actual – the time taken for a real walk down the garden.
- Field Imagery – the time taken for an imaginary walk in a field.
- Field Actual – the time taken for a real walk in a field.
Dealing with the data
- Calculate the ratio: Garden Imagery divided by Garden Actual. For example, suppose it took 40 seconds to image the walk and 60 seconds to do the walk, then you calculate 40/60, which is 0.667. Let’s call this value the Garden Ratio.
- Calculate the ratio: Field Imagery divided by Field Actual. Let’s call this value the Field Ratio.
Kosslyn’s prediction
Since mental imagery and visual imagery exploit the same mechanisms, there are two predictions:
- Both values should be close to 1.
- The actual values of the Garden Ratio and the Field Ratio should be very similar to each other.
The explanation of these predictions is as follows. It should take about the same time to imagine the walks as to do them. This being the case, the computed ratios should be close to 1 (i.e., around 0.8 to 1.2). Imagining an activity should not be dependent on the detail of the imagined walk, but the actual distance. Therefore the two ratios should be about the same values.
However, it is likely that it took less time to imagine the walks as to do them, in which case your ratio values are likely to be less than 1 and closer to 0.5 or below. Furthermore, since a garden has more detail and hence more landmarks than an open field, it is likely that it took longer to imagine the walk in the garden than it did to imagine the walk in the field (since the latter has fewer landmarks). In this case, your Field Ratio is likely to be smaller than your Garden Ratio.
Ask yourself:
- Is mental imagery really like seeing with your eyes shut?
- Why should there be any discrepancy between the time it takes for an imagined walk and the time the real walk takes?
- Does everyone have mental images? And do we use them in the same way?
- How is that we can know whether we imagined something versus when we actually saw something?
- Is it possible to measure mental imagery objectively?
References
Kosslyn, S.M. (1980). Image and Mind. Cambridge, MA: Harvard University Press.
Kosslyn, S.M. (1994). Image and Brain: The resolution of the imagery debate. Cambridge, MA: MIT Press.
Flashcards
Quiz
Chapter 4
Case study
CASE STUDY: Gibson’s theory of direct perception affordances
DownloadThe concept of affordances, originally proposed in Gibson’s “information pickup” theory of perception, has received a great deal of attention (e.g., Norman, 1988). In this case study, we examine the details of this concept and discuss why it is important.
Gibson rejected the notion that the study of visual perception should focus on the physical properties of objects in the environment. Instead, he focused on the idea that, when people view an object, they do not see its physical, molecular structure but rather its function. In this way, Gibson held that trying to understand visual processes without reference to the way in which animals interact with their environments can lead to a false understanding. Gibson defined affordances as follows: “the affordances of the environment are what it offers the animal, what it provides or furnishes, either for good or ill” (Gibson, 1979, p. 127). An affordance has three main properties:
1. An affordance exists relative to the action capabilities of a particular actor.
This means that an object can be perceived as having a certain use or function depending on the capabilities of the actor (the term “actor” is used to refer to the perceiver). Gibson used the example of a long, flat, rigid surface that can afford support for one person but may not afford support for another. Suppose you want to cross a muddy patch without getting mud on your shoes. You look around and there are several objects lying about. A plank of wood would afford support for you if it was the right size, was not porous and was strong enough to hold your weight. The same plank might not offer affordance to someone of a heavier weight. The point is that the concept of affordance is an interaction between the object and the perceiver’s capabilities. Another point is that, although the plank of wood may have been designed for something else, it still offers the affordance of support in this case.
2. The existence of an affordance is independent of the actor’s ability to perceive it.
This statement means that the affordance of an object is invariant and does not depend on it being perceived or detected. It is a property of the object and the current situation.
3. An affordance does not change as the needs and goals of the actor change.
This is a similar point to the previous one and emphasises the invariance of an affordance. It means that the affordances of an object are always present, even if the individual cannot detect them. In this way affordances are objective, in that they do not depend on interpretation, value or meaning. A plank can offer the affordance of support independent of the meaning or interpretation that the perceiver attaches to it. At the same time, without the presence of the perceiver, the affordance is meaningless. So, in the plank example, the plank’s affordances do not exist separately from the actor. In other words, an object’s affordance results from an interaction between it and the perceiver. Further, when an affordance exists and there is no physical barrier to its detection, direct perception is possible. This means an affordance can exist regardless of the individual’s experiences – for example, a hidden door in a wall panel affords the opportunity to move into another room, even though the person may not see it. However, detection of an affordance can depend on experience and culture (e.g., suspecting that there is a hidden door and finding it). The individual must learn to discriminate the information in order to detect affordances. Learning is seen as a process of discriminating between the patterns of information in the environment rather than as something that is used to supplement perceptual processes. A further point implied by Gibson’s theory is that affordances are binary – an affordance either exists or it doesn’t.
There has been some debate about the nature of affordances as described by Gibson. For example, Norman (1988) questions whether an affordance can ever exist outside perception. A designer, for example, may design a novel object whose function is immediately obvious to the user, and thus the designer and the user are using prior knowledge and experience.
McGrenere and Ho (2000) use the example of the design of a door to highlight the problems with Gibson’s and Norman’s views. Suppose there is a door with no handle and no flat panel. In order to know how to open the door, one would need previous experience with this type of door. According to Gibson’s definition, the fact that the door can be opened means that it has an affordance, even though the actor may have no idea how to open it. According to Norman, however, its affordance only exists when the user has prior knowledge of how to open it – the action possibility of the door needs to be conveyed to, or perceived by, the user. One implication of this is that an affordance may not be binary, as Gibson described. An object may have an action possibility, but this may be hard to detect (e.g., a hidden door) or hard to achieve (e.g., a flight of stairs that afford ascent but are very difficult to climb because they are covered in snow).
This debate is not just about two schools of thought nit-picking over details that are irrelevant in the real world. On the contrary, it has been extremely useful for designers wanting to develop “user-friendly” products and services (McGrenere & Ho, 2000). By studying the affordances of objects, designers can produce better designs. Gaver (1991) discusses how Gibson’s ideas emphasise the importance of two things about design: the real affordance of an object, such as what it is used for, and its perceived or apparent affordance, or the design that suggests an affordance. When the real and apparent affordances match, then the artefact is easy to use and the instructions for use can be at a minimum; when they mismatch, errors are common and extra instructions will be required.
References
Gaver, W.W. (1991). Technology affordances. CHI ’91 Conference Proceedings, New Orleans, Louisiana, 27 April–2 May, pp. 79–84.
Gibson, J. J. (1979). The Ecological Approach to Visual Perception. Boston, MA: Houghton Mifflin.
Green, J.G. (1994). Gibson’s affordances. Psychological Review, 101: 336–342.
McGrenere, J. & Ho, W. (2000). Affordances: Clarifying and evolving a concept. Proceedings of Graphics Interface 2000, Montreal, May 2000. Available online.
Norman, D.A. (1988). The Psychology of Everyday Things. New York: Basic Books.
Flashcards
Quiz
Chapter 5
Case study
CASE STUDY: Multi-tasking efficiency: serial or parallel processing strategy?
DownloadPerformance optimisation in multi-tasking is a controversial topic, sparking much debate around whether cognitive processes relate to different tasks are processed sequentially or in parallel.
One of the central aims that cognitive psychology and cognitive neuroscience attempts to address is the ability to understand, and optimise, the processes underlying multi-tasking to increase efficiency when dealing with multiple tasks. Many psychologists have argued that bottleneck – a process that limits our ability to process several simultaneous inputs – is the cause of the typical decline in performance, often seen in tasks requiring the participant to multi-task (Pashler, 1998). On the other hand, others have argued that parallel processing is possible by means of capacity sharing although serial processing may reflect the more efficient strategy for multi-tasking.
To fully understand this argument, it is important to understand the terms “parallel processing” and “serial processing”. When a task is carried out with another task (i.e., the two tasks are performed together), the individual might use serial or parallel processing. When an individual switches attention between two tasks – their attention moving backwards and forwards – with only one task being processed, this is known as serial processing. When individuals carry out two or more tasks at the same time, this typically results in severe performance costs – this means, the error rate is greater.
Early work on multi-tasking assumes that access to a single processing channel is ordered sequentially. For example, if Task A enters the capacity-limited processing stage, any additional task that is being processed at the same time as Task A (e.g., Task B), will not be further processed. This means that until Task A critical processing has finished, Task B’s processing will remain halted. Subsequently, serial task scheduling is the result of a capacity-limited processing bottleneck that is structural in nature (Broadbent, 1958). This has been a core view of the response-selected bottleneck (RSB) model (Pashler & Johnston, 1989). Therefore, the peripheral processing of dual tasks is carried out in parallel; in contrast, central processing is capacity-limited and so does not proceed in parallel (Pashler & Johnston, 1989).
The limitations on central processing, which cause dual-task costs, have been at the centre of the theoretical assumptions of experimental psychology for decades. Two-choice reaction-time tasks are presented with the stimuli of Task 1 (T1) and Task 2 (T2) varying in the time interval between their onset. The performance of Task 1 is unaffected by task overlap manipulation. However, Task 2 depends on the proximity of both tasks. The literature suggests that the shorter the gap between stimulus onset (for T1 and T2), the slower the reaction time and the higher the error rate seen in Task 2. This concept is known as the psychological refractory period (PRP). PRP has been widely used as a measure of dual-task cost; first developing at the capacity-limited response-selection stage in multi-tasking. It is important to note that the costs of carrying out two tasks simultaneously serves as a marker for multi-tasking efficiency (Fischer & Plessow, 2015).
Early researchers have identified two factors that determine the possibility of processing tasks in parallel: task similarity and task practice. Allport et. al. (1972) argued that multi-tasking costs do not result from exceeding the capacity of a single-channel processor but from the difficulty of separating two similar tasks. They demonstrated that when two dissimilar tasks are combined, processing is done in parallel to the same quality as single-task processing. Similarly, Shaffer (1975) showed skilled typists can easily perform copy typing with a verbal shadowing task in parallel yet fail in combining an audiotyping task with reading from a sheet (Halvorson & Hazeltine, 2015).
Several researchers believe that by adopting a parallel strategy the individual is benefitted in terms of dual-task efficiency. Miller and colleagues (2009) demonstrated that parallel processing can outperform serial processing, in terms of dual-task efficiency. They showed that when participants carried out tasks simultaneously, they produced patterns of parallel processing; increased reaction times for Task 1 with decreased reaction times for Task 2.
They also demonstrated that asynchrony manipulation prior to stimulus onset determined the efficiency of parallel and serial processing modes. Emphasis on Task 1 performance shows a favoured resource allocation that benefits the processing of Task 1; all resources are therefore, dedicated to Task 1. Consequently, this is an example of serial processing.
However, when specific priority instructions are disregarded, individuals freely choose a parallel processing strategy (Lehle & Hübner, 2009). Lehle and Hübner (2009) also demonstrated that parallel processing is associated with less mental effort. In their 2009 study (Lehle et al., 2009), 28 participants were tasked with employing a serial or parallel processing strategy. Parallel processing showed higher performance costs than serial processing, but serial processing was judged as more effortful. Therefore, although it may not be the most efficient way of multi-tasking, parallel processing reflects a less effortful processing strategy compared to a stricter serial processing, and, given the choice, participants tend to adopt the processing mode with the least mental effort (Kool et. al., 2010). Furthermore, it also suggests a compromise between optimisation in performance and minimising mental effort (Lehle et al., 2009).
While serial task processing appears to be the most efficient, multi-task processing is favoured by a parallel strategy. By adopting a more flexible and context-sensitive processing strategy, individuals will be able to adjust to environmental demands, providing mechanisms important for adaptive intelligent behaviour (Goschke, 2013).
References
Allport, A., Antonis, B. & Reynolds, P. (1972). On the division of attention: A disproof of the single channel hypothesis. Quarterly Journal of Experimental Psychology, 24, 225–235.
Broadbent, D.E. (1958). Perception and Communication. London: Pergamon Press.
Fischer, R. & Plessow, F. (2015). Efficient multitasking: Parallel versus serial processing of multiple tasks. Frontiers in Psychology, 6 (1366), 1–11.
Goschke, T. (2013). Volition in action: Intentions, control dilemmas and the dynamic regulation of cognitive intentional control. In W. Prinz, A. Beisert and A. Herwig (ed.), Action Science: Foundations of an emerging discipline (pp. 409–434). Cambridge, MA: MIT Press.
Halvorson, K.M. & Hazeltine, E. (2015). Do small dual-task costs reflect ideomotor compatibility or the absence of crosstalk? Psychonomic Bulletin Review,22 (5), 1403–1409.
Kool, W., McGuire, J.T., Rosen, Z.B. & Botvinick, M.M. (2010). Decision making and the avoidance of cognitive demand. Journal of Experimental Psychology General, 139, 665–682.
Lehle, C., and Hübner, R. (2009). Strategic capacity sharing between two tasks: Evidence from tasks with the same and with different task sets. Psychological Research, 73, 707–726.
Lehle, C., Steinhauser, M. & Hübner, R. (2009). Serial or parallel processing in dual tasks: What is more effortful? Psychophysiology, 46 (3), 502–509.
Miller, J., Ulrich, R. & Rolke, B. (2009). On the optimality of serial and parallel processing in the psychological refractory period paradigm: effects of the distribution of stimulus onset asynchronies. Cognitive Psychology, 58, 273–310.
Pashler, H. (1998). The Psychology of Attention. Cambridge, MA: MIT Press.
Pashler, H. & Johnston, J.C. (1989). Chronometric evidence for central postponement in temporally overlapping tasks. Quarterly Journal of Experimental Psychology, 41, 19–45.
Shaffer, L.H. (1975). Multiple attention in continuous verbal tasks, In P.M.A. Rabbitt and S. Dornic (eds), Attention and Performance V (pp. 157–167). New York: Academic Press.
Research activity
RESEARCH ACTIVITY: Skill acquisition and the power law
DownloadThe relationship between practice and performance in perceptual motor skills has been captured by the power law of practice. This law states that, if the time per trial and number of trials are graphed on log–log coordinate axes, then a straight line results. According to Logan (1988), the law also applies to cognitive skills. Several theories have attempted to explain the effects of practice. The question this activity attempts to address is whether the learning rates of a simple perceptual motor skill and a simple cognitive skill are acquired at the same rate when the learning strategy is similar.
Instructions: perceptual motor skill
Three juggling balls are required (about 3 or 4 cm in diameter), and a pen and paper to record progress. Draw two columns on the paper and list the first column as “Trials” and the second column as “Throws completed”. Number the rows in the trial column from 1 to 30. The aim of the exercise is to attempt to juggle the balls, with the goal of juggling ten complete throws, where one complete throw consists of moving one ball from one hand to the other by throwing and catching it without dropping any of the balls.
Learning method: how to learn to juggle
A note about throwing and catching: when you throw a ball from one hand to the other, throw upwards with some height. This will give you more time to prepare for catching. Also throw the ball slightly along, so that it moves towards the other hand (otherwise you will have to move your body towards it). You do not want to have to move your body to catch a ball, otherwise you will be out of position to catch the next ball.
- Begin by holding two balls in the left hand and one ball in the right hand.
- One complete throw. Throw one ball from the left hand to the right hand. This is one throw.
- If you successfully caught the ball in your right hand and did not drop any of the balls then proceed to step 4, otherwise go back to step 1 and record one throw completed for the trial.
- Hold two balls in the left hand and one ball in the right hand.
- Two complete throws. Throw one ball from the left hand to the right hand, but while the ball is in mid-air throw the ball in the right hand to the left hand. Catch both of the balls.
- If you successfully caught both balls and did not drop any, then proceed to step 7, otherwise go back to step 1 and record two throws completed for this trial.
- Hold two balls in your left hand and one in your right hand.
- Three complete throws. Throw one ball from the left hand to the right hand, but while the ball is in mid-air throw the ball in the right hand to the left hand. Catch the ball coming to your right hand and throw the ball in your left hand. Next, catch the ball coming to your left hand and catch the ball coming to your right hand.
- If you successfully caught all three balls and did not drop any, then proceed to step 10, otherwise go back to step 1 and record three throws completed for this trial.
- Hold two balls in your left hand and one in your right hand.
- Now, try for four complete throws, by throwing three as described above then repeating the first throw (left hand to right hand). If you make an error, go back to step 1 and record four for this trial, otherwise go to the next step.
- Repeat the process by holding the balls each time in the same starting position and increase your target to one extra throw if you have not made any errors in the previous throw. Each time you drop a ball you have to go back to step 1 and record the number of completed throws. Do this for 30 trials.
Instructions: learning to count in another language
You will need the numbers 1 to 20 from a language with which you have no experience printed in word form. Draw two columns on the paper and list the first column as “Trials” and the second column as “Number completed”. Number the rows in the trial column from 1 to 30. The aim of the exercise is to attempt to learn to count (by writing the numbers) in the foreign language, with the goal of counting to 20 without a single error.
The method of learning
In Spanish (for example) the numbers 1 to 20 are:
- uno
- dos
- tres
- cuatro
- cinco
- seis
- siete
- ocho
- nueve
- diez
- once
- doce
- trece
- catorce
- quince
- dieciséis
- diecisiete
- dieciocho
- diecinueve
- veinte
- Read the list of numbers from 1 to 20.
- Hide the numbers and write down the word for 1.
- Check your answer and if it is correct, go to step 4, otherwise score 0 for this trial and go to step 1.
- Hide the numbers and write down the words for 1 and 2.
- Check your answers and if they are perfectly correct, go to step 5, otherwise score 1 for this trial and go to step 1.
- Hide the numbers, and write down the words for 1, 2 and 3.
- Check your answers and if they are perfectly correct, go to step 8, otherwise score 2 for this trial and go to step 1.
- Hide the numbers, and write down the words for 1, 2, 3 and 4.
- Check your answers and if they are perfectly correct, go to step 10, otherwise score 3 for this trial and go to step 1.
- Continue this process by increasing the target number by 1 if you have made no mistakes. Each time you make a mistake, record the number you counted correctly to and go to step 1. Do this for 30 trials.
Dealing with the data
The first thing to do is to compute the log value of each trial number and the score for each trial. The log values for 1 to 30 are calculated in the table below (to two decimal places).
Number |
Log value |
1 |
0.00 |
2 |
0.30 |
3 |
0.48 |
4 |
0.60 |
5 |
0.70 |
6 |
0.78 |
7 |
0.85 |
8 |
0.90 |
9 |
0.95 |
10 |
1.00 |
11 |
1.04 |
12 |
1.08 |
13 |
1.11 |
14 |
1.15 |
15 |
1.18 |
16 |
1.20 |
17 |
1.23 |
18 |
1.26 |
19 |
1.28 |
20 |
1.30 |
21 |
1.32 |
22 |
1.34 |
23 |
1.36 |
24 |
1.38 |
25 |
1.40 |
26 |
1.41 |
27 |
1.43 |
28 |
1.45 |
29 |
1.46 |
30 |
1.48 |
The first step is to reproduce this table in a spreadsheet (such as a sheet in Microsoft Excel). Add a third column called “Motor score” and a fourth column called “Cognitive score” and insert the data gathered from both tasks.
Next, add a fifth column called “Log motor” and a sixth column called “Log cognitive” and enter the corresponding log values. You do not need to use a calculator for these, simply use the table for converting the scores to log values. For example, if on trial 8 you counted correctly to 5 then enter 0.7 as the data for this trial, i.e., from the table, log(8) = 0.7.
The next task is to plot the data on a graph, such as a spreadsheet scatter chart.
You should end up with a graph that looks something like this (a scatterplot of some example data):
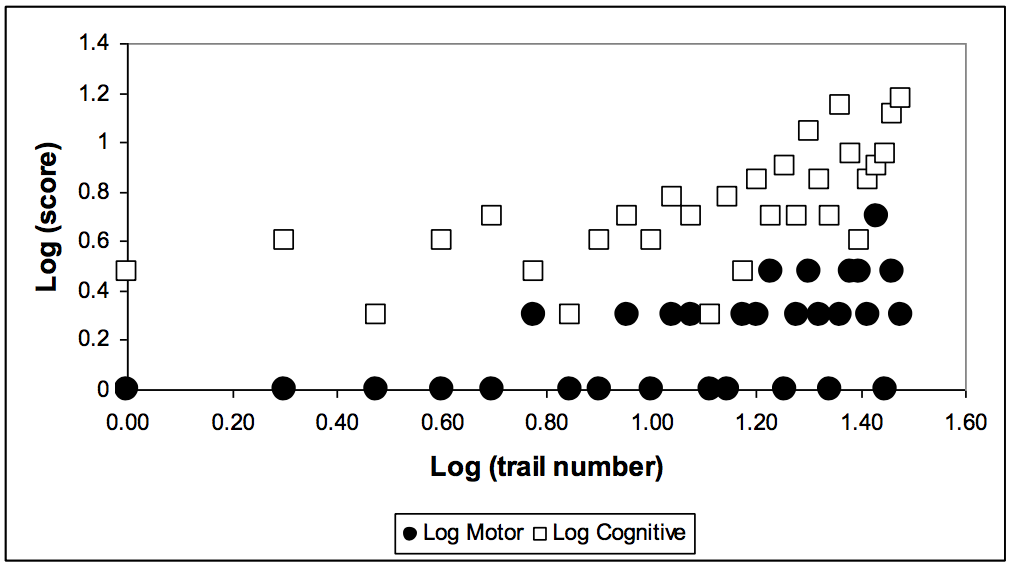
Ask yourself:
- Do the points for the log values of the cognitive scores appear to conform to a straight line?
- Do the points for the log values of the motor scores appear to conform to a straight line?
- Which type of skill approximates more closely to a straight line?
- Does it make sense to compare cognitive and motor skill acquisition (when the tasks are very different)?
- Do you think that the acquisition of a different motor skill (e.g., riding a bicycle) would produce a different graph?
- Do you think that the acquisition of a different motor skill (e.g., learning to play noughts-and-crosses or tic-tac-toe) would produce a different graph?
- Can the power law of practice accommodate the phenomenon of insight?
Predictions
Ericsson’s theory of deliberate practice (e.g., Ericsson et al., 1993; Ericsson & Lehmann, 1996) was developed to explain expertise for cognitive skills. This theory suggests motor skills, such as juggling, should be acquired at a different rate from cognitive skills (and hence cognitive skills may not conform to the power law of practice). However, several other theories, for example Anderson (1993), predict that they should both be acquired according to the power law of practice. In terms of the current activity, which one is right?
References
Anderson, J.R. (1993). Rules of the Mind. Hillsdale, NJ: Lawrence Erlbaum Associates.
Ericsson, K.A. & Lehmann, A.C. (1996). Expert and exceptional performance: Evidence of maximal adaptations on task constraints. Annual Review of Psychology, 47, 273–305.
Ericsson, K.A., Krampe, R.T. & Tesch-Römer, C. (1993). The role of deliberate practice in the acquisition of expert performance. Psychological Review, 100, 363–406.
Logan, G.D. (1988). Toward an instance theory of automatization. Psychological Review, 95, 492–527.
Flashcards
Quiz
Chapter 6
Case studies
CASE STUDY: The revised model of working memory – the episodic buffer
DownloadBaddeley and Hitch (1974) proposed the model of working memory with three components: the visuo-spatial sketchpad, the phonological loop and the central executive. This model has been successful in accounting for a broad range of data from laboratory studies of immediate recall, as well as data obtained from neuropsychological, developmental and neuroimaging studies. However, more recently, Baddeley (2000) has added a fourth component to the model, the episodic buffer, which is said to play a role in the processes of integrating information between the subsystems and the central executive. Moreover, it is said to be comprised of a limit capacity system that provides the temporary storage of information from the secondary systems and from the long-term memory system in a single episodic representation (Baddeley, 2018).
As successful as the earlier formulation of the model has been, Baddeley concedes “there have always been phenomena that did not fit comfortably within the Baddeley and Hitch model” (p. 417). In particular, there are data that are problematic for the phonological loop.
Articulatory suppression
For example, in studies of articulatory suppression, in which the participant repeats the word “the” while learning a visually presented list of numbers, the model predicts that recall will be poor. This is predicted based on the assumptions that (1) visual information has indirect access to the phonological loop (via subvocal rehearsal) and (2) articulatory suppression should prevent visual information from gaining access to the phonological loop. However, the data show that articulatory suppression only results in a small reduction in recall, typically from seven to five digits (Baddeley et al., 1984). In addition, in studies of brain-damaged patients, individuals with impaired short-term memory show better recall for visually presented digits than for auditorily presented digits. The older version of the model is unable to account for these findings, not even by including an explanation based on the visuo-spatial sketchpad. This structure is assumed to capture a single representation of a complex pattern and to be poor at storing serial information.
Recall of prose
When participants are presented with a list of unrelated words, recall is limited to about five or six items. However, when words are related (as in prose) correct recall can be increased to 16 or so items (Baddeley et al., 1987). A recognised explanation for this is that prose utilises information in long-term memory, which has the effect of reducing the amount of information needed to be recalled into smaller chunks, whereas unrelated words do not. Chunks of information are not represented easily in the older version of the model, since it is not a function of the phonological loop, nor do chunks reside in long-term memory. Similarly, in studies of the recall of prose, typical recall is of about 15 to 20 idea units. This amount exceeds the capacity of the phonological loop; it cannot be accounted for by the storage of a pattern in the visuo-spatial sketchpad; and the central executive is assumed to have no storage capacity at all. Retention of this amount of information seems to involve structures within long-term memory.
Subvocal rehearsal
A key component of working memory is that there are separate processes for storage and retrieval. Recall is said to be achieved through subvocal rehearsal of the to-be-remembered items. Support for this comes from the finding that articulatory suppression does not affect the word-length effect (a list of long words is more difficult to recall than a list of short words) when items are presented auditorily, yet it does when items are presented visually. In the case of visual presentation, items cannot be rehearsed subvocally and hence recall is independent of the length of the word. However, what is problematic for the theory is that, although children only begin to show signs that they use subvocal rehearsal by the age of 7, some form of rehearsal occurs in children as young as 3 years old. Such rehearsal cannot be explained by the function of the visuo-spatial sketchpad.
The binding problem
Every object has several features, such as its physical shape and size, its location, its colour, whether it is moving and so on. When we perceive more than one object, in most cases we correctly associate the right features with the right object. The binding of an object to its associated features, which is assumed to take place in the brain, serves to avoid incorrect combinations of features of objects. It is not clearly understood how binding is achieved. Baddeley has suggested that working memory plays an important role in binding through the role of the central executive, since the model is essentially concerned with the integration of information from more than one modality. However, since the central executive has no “short-term multi-modal store capable of holding such complex representations” (Baddeley, 2000, p. 421), it is inadequate in explaining the binding problem.
The episodic buffer
The solution to the problems of the previous formulation of working memory is the episodic buffer, which has the following features:
It is of limited capacity.
It is a temporary storage system.
It can integrate information from a variety of sources (perception and long-term memory).
It is controlled by the central executive through conscious awareness.
It holds episodes of information that are across space and over time.
It plays an important role in the storage and retrieval of episodic long-term memory.
It may reside in the right frontal areas.
In sum, the episodic buffer takes the form of a short-term episodic memory. Whereas the previous formulation of the model focused on separating out the individual components of working memory, the emphasis of the new model is now on the integration of information. It is also suggested that the episodic buffer forms “the crucial interface between memory and conscious awareness” (Baddeley, 2000, p. 422).
References
Baddeley, A.D. (2000). The episodic buffer: A new component of working memory? Trends in Cognitive Science, 4 (11): 417–423.
Baddeley, A.D. (2018). The episodic buffer: A new component of working memory? In A.D. Baddeley (ed.), Exploring Working Memory: Selected works of Alan Baddeley (pp. 297–311).London: Routledge.
Baddeley, A.D. & Hitch, G.J. (1974). Working memory. In G.H. Bower (ed.), The Psychology of Learning and Motivation: Advances in research and theory (pp. 47–89). London: Academic Press.
Baddeley, A.D., Lewis, V. & Vallar, G. (1984). Exploring the articulatory loop. Quarterly Journal of Experimental Psychology, 36: 233–252.
Baddeley, A.D., Vallar, G. & Wilson, B.A. (1987). Sentence comprehension and phonological memory: Some neurophysiological evidence. In M. Coltheart (ed.), Attention and Performance XII: The psychology of reading (pp. 509–529). Hove, UK: Lawrence Erlbaum Associates.
CASE STUDY: Automatic processes, attention and the emotional Stroop effect
DownloadThe Stroop effect (Stroop, 1935) occurs when participants are required to name the colour in which a set of words are printed:
- In the congruent condition, the words are printed in the same colour as the word itself (e.g., the word blue printed in blue ink or the word red printed in red ink).
- In the incongruent condition, the word and the colour in which it is printed differ (e.g., the word blue printed in red ink).
As you might predict, participants are slower to name the ink colours in the incongruent condition than in the congruent condition. The reasoning is that reading the words, as an automatic process, cannot be avoided, and this interferes with naming the colours.
In the emotional Stroop task (e.g., Williams et al., 1996), participants are required to name the ink colour of words, just as in the Stroop task, however now the words are either emotional words (especially threatening words, such as kill) or neutral words. When the participants used in this study had high levels of trait anxiety (that is, they had a long-term disposition towards being anxious, though not necessarily clinically anxious), they were slower to name the colour of the emotional words compared to the neutral words, and slower than those participants with low levels of trait anxiety.
Since the slowed responses in the Stroop task are thought to be due to the automatic processing of the words, it is not inconsistent to suppose that the slowed responses of individuals with high levels of trait anxiety on the emotional Stroop task are due to the automatic processing of emotional information.
In a study by Dresler et al. (2009), arousal was found to determine emotional inference independent of valence. These words were better recalled and recognised, more so than neutral words. The determined individual differences in anxiety states were associated with emotional interference, where emotional interference was more enhanced in individuals with a high state of anxiety. They concluded that word arousal produces emotional interference independent of valence, suggesting that a state of anxiety exacerbates interference of emotional words by biasing attention towards emotionally salient stimuli.
Studies such as this have raised the issue of whether there is an attentional bias towards threat in individuals with raised levels of anxiety, and whether such biases are automatic (in the sense that they occur rapidly and without voluntary intent). If you are afraid of spiders, you may have first-hand experience of this idea. Imagine you are in the attic looking for some old photographs and you notice something out of the corner of your eye. Given that it’s an attic, full of old cobwebs, you would be forgiven for assuming that the movement in the corner of your vision is a spider! Someone without a fear of spiders might either (a) not even notice the movement or (b) assume that it was something else.
This example demonstrates what has been found in people who are prone to anxiety – they tend to notice potential dangers and threats more easily and much sooner than people who are less prone to anxiety. Clearly, there is a payoff for the anxious person who notices a threat sooner rather than later: they can take evasive action before being harmed. However, anxious people often make the error of thinking that something is dangerous or threatening when it is harmless. This rapid switching of attention towards threat has been observed in the laboratory in anxious students as well as in people diagnosed with an anxiety disorder.
To further support this concept, event-related potentials (ERPs) of individuals have been examined. ERPs are patterns of electroencephalograph (EEG) activity obtained by averaging the brain responses to the same stimulus (or very similar stimuli) presented repeatedly. A study by Metzger and colleagues (1997) used ERPs to investigate the emotional Stroop effect in individuals with post-traumatic stress disorder (PTSD). Results indicated those with PTSD had a slower reaction time when naming word colours, particularly traumatic words, indicating a processing bias towards trauma-related information in PTSD. These results were accompanied by significantly delayed and reduced P3 components – an ERP component elicited in the process of decision-making that links to a participant’s reaction to a stimulus – across all word types, suggesting Stroop interference was not related to differences in attention-related processing of trauma- versus non-trauma-related words.
On the other hand, there are inferences within the literature that suggest ERPs are a more sensitive measure of attentional biases than reaction time measures (Thomas et al., 2007). Several ERP studies on healthy individuals have found larger ERP amplitudes in response to emotional stimuli relative to neutral stimuli – and in emotionally negative stimuli relative to emotionally positive stimuli. This suggests that preferential processing is evident when examining ERP amplitudes rather than reaction time measures.
Bernat et al. (2001) used undergraduates who were required to watch words that appeared on a computer screen and found that unpleasant words elicited more positive amplitudes than pleasant words across all ERP components. P100, N1 and P200 are potentials that have been identified with visual processing, while P300 is an ERP component elicited in the process of decision-making. Weinstein (1995) found no reaction time differences between the performances of low- and high-anxiety individuals, but showed larger N100 (a visual or auditory ERP component) and P400 (an ERP response to words and other visual stimuli) ERP amplitudes for those individuals with high anxiety.
Overall, there are suggestions within the literature that indicate that larger ERP amplitudes to negative emotional stimuli are a demonstration of sensory and cognitive component activation when using both pictorial and word stimuli, and in the absence of any observed differences behaviourally. These patterns have been interpreted as an indication of adaptive “negativity bias” – an attentional bias that prioritises the processing of negative over mundane stimuli occurring within the general population (Carretie et al., 2001). It is concluded that ERPs are a sensitive measure of processes underlying emotional Stroop performance, which can be used to elucidate attentional biases in healthy and clinical populations (Thomas et al., 2007).
In many of these experiments, highly anxious individuals have been found to direct their attention towards items related to personal threat (e.g., words related to health, or photographs of mutilation) when these items appear alongside more neutral items. For example, when a smiling face and an angry face are presented at the same time on a computer screen, the anxious individual looks at the angry face first.
Two words are presented on the screen, one on the left side and the other on the right side – one word is a threatening word (e.g., dagger) and the other word is a non-threatening word (e.g., number). Suppose dagger is presented to the left and number to the right. An anxious person would orient towards the word dagger, while a low-anxiety person would treat each word equally. The probe is then presented on the screen in the middle of the word dagger (e.g., dag*ger). If the participant is looking at dagger, then they will be able to respond sooner than if they had been looking at the word number. In this way it is possible to infer the direction of attention by use of a probe and reaction time.
Apart from the emotional Stroop task, another much-used task is the “dot probe” method for measuring attention, as devised by MacLeod and Mathews (1988). The idea is that a probe, such as an asterisk (*), is presented on a computer monitor, and the participant is required to press a button as soon as he or she sees it appear. Now, if the person just happens to be looking in the place where the probe appears, then they will respond faster than if they had been looking in a different area of the screen. Therefore, we can measure the reaction time of the button press, and it will be related to where the person was looking and where the asterisk appeared.
Specificity of attentional bias
Research has shown that connotations of what an anxious person fears most attracts the most attention. As examples:
- People with a spider phobia attend to words such as hairy or creepy.
- People with a social phobia attend to words related to socialising (e.g., party).
- People with an eating disorder attend to words related to food (e.g., chocolate).
- Anxious students tested just before their exams have been shown to attend to words related to success and failure (e.g., error).
The tendency for anxious individuals to perceive a threat does not seem to depend on conscious awareness or deliberate intent, as attentional bias has been found to exist even for stimuli that cannot be reported, such as when the words are presented subliminally (e.g., Mogg et al., 1993). It may be, therefore, a behaviour that is difficult to control or suppress (and this then has implications for therapy).
In contrast, research has suggested that individuals with generalised anxiety disorder (GAD) show an attention bias for threatening information that is relevant (Amir et al., 2009). In a study by Amir et al. (2009), participants were required to complete a probe detection task by identifying letters (E or F) replacing one member of a word pair. Attention was trained by the inclusion of a contingency between the probe location and the non-threatening word in the group. Participants in the attention modification programme (AMP) showed change in attention bias and a decrease in anxiety. These effects were not present in the attention control condition. These results are consistent with the notion that attention plays a causal role in the maintenance of GAD, further suggesting that altering attention mechanisms may effectively reduce anxiety.
References
Amir, N., Beard, C., Burns, M. & Bomyea, J. (2009). Attention modification program in individuals with generalised anxiety disorder. Journal of Abnormal Psychology, 118 (1), 28–33.
Bernat, E., Bunce, S. & Sherin, H. (2001). Event-related brain potentials differentiate positive and negative mood adjectives during both supraliminal and subliminal visual processing. International Journal of Psychophysiology, 42 (1), 11–34.
Carretie, L., Martin-Loeches, M., Hinojosa, J.A. & Mercado, F. (2001). Emotion and attention interaction studied through Event-Related Potentials. Journal of Cognitive Neuroscience, 13 (8), 1109–1128.
Dresler, T., Mériau, K., Heekeren, H.R. & Van Der Meer, E. (2009). Emotional Stroop task: Effect of word arousal and subject anxiety on emotional interference. Psychological Research PRPF, 73 (3), 364–371.
MacLeod, C. & Mathews, A. (1988). Anxiety and the allocation of attention to threat. The Quarterly Journal of Experimental Psychology,40A, 653–670.
Metzger, L.J., Orr, S.P., Lasko, N.B., McNally, J. & Pitman, R.K. (1997). Seeking the source of emotional Stroop interference effects in PTSD: A study of P3s to traumatic words. Integrative Physiological and Behavioral Science, 32 (1), 43–51.
Mogg, K., Bradley, B.P., Williams, R. & Mathews, A. (1993). Subliminal processing of emotional information in anxiety and depression. Journal of Abnormal Psychology, 102(2), 304–311.
Stroop, J.R. (1935). Studies of interference in serial verbal reaction. Journal of Experimental Psychology, 18 (6), 643–662.
Thomas, S.J., Johnstone, S.J. & Gonsalvez, C.J. (2007). Event-related potentials during an emotional Stroop task. International Journal of Psychophysiology, 63 (3), 221–231.
Weinstein, A.M. (1995). Visual ERPs evidence for enhanced processing of threatening information in anxious university students. Biological Psychiatry, 37, 847–858.
Williams, J.M., Mathews, A. & MacLeod, C. (1996). The emotional Stroop task and psychopathology. Psychological Bulletin, 120, 3–24.
Research activity
RESEARCH ACTIVITY: Phonemic similarity
DownloadAccording to Alan Baddeley (1986, 1990), the phonological loop was theorised, in part, to account for the finding that information in short-term memory is coded phonemically. For example, when seeing a list of words, mistakes in recall are often based on the sounds of the words; that is, mistakes based on the phonemic structure of the word. To illustrate this for yourself, try the following exercise (which is crudely based on an experiment in Baddeley, 1966).
Instructions
Print the table below and then fold the piece of paper in half vertically – folding it outwards not inwards. On the left are your test words; put your answers on the right-hand side. The aim is to recall the sequence of letters in the exact order in which you read them. For example, if the test items are q w e r t y u i, then you would write down q w e r t y u i. Read the first six letters of row 1 quietly to yourself once and then immediately turn the page over and write down your answers. Try not to cheat because you are not testing your own ability but your (theoretical) “phonological loop”. After you have completed the task, follow the procedure for scoring your responses.
1 |
H |
S |
F |
Q |
B |
C |
D |
P |
|||||||||||
2 |
G |
D |
B |
T |
Z |
H |
R |
S |
|||||||||||
3 |
Q |
M |
Z |
R |
C |
P |
D |
G |
|||||||||||
4 |
T |
P |
C |
B |
F |
M |
Q |
Z |
|||||||||||
5 |
F |
R |
Z |
S |
B |
P |
G |
T |
|||||||||||
6 |
C |
G |
B |
P |
M |
Q |
H |
R |
|||||||||||
7 |
H |
Q |
R |
M |
C |
T |
D |
B |
|||||||||||
8 |
D |
P |
T |
C |
R |
Z |
F |
H |
|||||||||||
9 |
M |
R |
H |
Z |
C |
G |
B |
T |
|||||||||||
10 |
B |
T |
G |
P |
R |
F |
M |
S |
|||||||||||
Total for even rows: |
|||||||||||||||||||
Total for odd rows: |
|||||||||||||||||||
Total of values in bold boxes |
|||||||||||||||||||
Total of values in normal boxes |
|||||||||||||||||||
Scoring
- Place a small circle around items that are incorrect. For example, if I wrote q w e r y u t i as my answer to the first example, then I would mark this by placing a circle around y, u and t (as although y and u were in the original list, they are in the wrong order).
- For each column, add up the number of circled items for the even rows.
- For each column, add up the number of circled items for the odd rows.
- Add the totals in the tinted boxes together (this value is the total number of errors with letters that rhyme: B, C, D, G, P, T).
- Add the totals in the normal boxes together (this value is the total number of errors with letters that do not rhyme: H, F, M, Q, R, S, Z).
- Compare the two totals.
Prediction
Baddeley’s theory of phonological encoding predicts that you should have a greater number of errors for letters that rhyme than for letters that do not rhyme, even though you have not verbalised the letters during learning.
Example:
Total for even rows: |
0 |
1 |
1 |
0 |
0 |
1 |
1 |
1 |
|
Total for odd rows: |
0 |
0 |
0 |
0 |
1 |
2 |
2 |
1 |
|
Total of values in bold boxes |
8 |
||||||||
Total of values in normal boxes |
3 |
||||||||
In this example more errors were made on trials with rhyming words than on trials with non-rhyming words. There also appears to be a strong primacy effect.
Ask yourself:
- Is there a primacy or recency overall effect in your data?
- If so, how might this affect the prediction of the theory?
- Did you find yourself trying to rehearse the items before you wrote them down?
- What other learning strategies did you use?
- Do you think the results would be any different if you repeated the letters aloud during learning?
- Try testing a friend. Do they get similar results? If you add your data together, does a pattern emerge?
References
Baddeley, A.D. (1966). The influence of acoustic and semantic similarities on long-term memory for word sequences. Quarterly Journal of Experimental Psychology, 18, 302–309.
Baddeley, A.D. (1986). Working Memory. Oxford: Clarendon Press.
Baddeley, A.D. (1990). Human Memory: Theory and practice. Hove, UK: Psychology Press.
Flashcards
Quiz
Chapter 7
Case study
CASE STUDY: Amnesia and long-term memory: the case of H.M.
DownloadAmnesia is characterised by memory impairment in patients who have intellectually intact functions and intact immediate memory span (Sanders & Warrington, 1971). Some of the central components for the syndrome include defective learning and retention of ongoing events. Another consistent research finding is memory loss for events before the onset of the illness, in retrograde amnesia.
There have been several cases studying memory following brain damage. H.M. is one of the most notorious cases in neuroscience. He was the first patient to undergo neurosurgery to attempt to cure his seizures, unfortunately the surgery left him with severe memory impairment. The study of H.M. led to insight on how the brain can reorganise itself following damage.
As well as intact and perceptual functions, despite having a large medial temporal lobe (MTL) lesion, H.M. had a significant capacity for sustained attention, including the ability to retain information for a period of time long after it was presented (Squire, 2009). It also appeared that H.M. exhibited intact digit span. This information remained intact so long as it could be actively maintained by rehearsal. H.M. could retain a three-digit number for 15 minutes by continuous rehearsal; organising the digits according to a mnemonic scheme he created. However, when his attention was centred on a new topic, the whole event was forgotten.
In contrast, when the material was hard to rehearse, it was found that his recall ability was significantly worse, and information was forgotten in less than a minute. These key findings have supported fundamental distinctions made between immediate memory and long-term memory (LTM), suggesting damage to the medial temporal lobe can inhibit long-term memory learning and recall (Baddeley & Warrington, 1970). Furthermore, the distinction between these types of memory has been a key concept in psychological research in understanding how the brain organises its memory functions (Squire, 2009).
Additional insight from work on H.M. arose in terms of multiple memory systems. Given his profound and global memory impairment, H.M.’s visuo-motor skills were spared; when he was asked to draw a five-pointed star, which was shown as a reflective mirror image, his ability to do so was excellent, and he could retain this information over three days. However, at the end of testing, H.M. had no recollection of having done the task before (Milner, 1962). This finding provided evidence to suggest that there is more than one memory system, and some kinds of memory lie outside the MTL province.
Despite wide acceptance of motor skills as a special case, it later became apparent that motor skills are but a subset of a larger domain of skill-like abilities, all of which are preserved in amnesic patients. This ability to preserve learned perceptual skills (of mirror reading) suggested there is a distinction between two classes of knowledge: declarative and procedural (Cohen & Squire, 1980). Consequently, it was concluded that H.M. had a declarative memory impairment, which is entirely dependent on the MTL. The finding that memory is not a single faculty of the mind, ultimately led to the identification of a multiple memory system.
A key insight from studying H.M.’s memory came from a consideration of his capacity to remember information that he had acquired before surgery. First, H.M.’s ability to recognise faces he might have seen in the news during the 1950s and 1960s was just as good as, if not better than, age-matched controls. This implied that the MTL is not the sole unit for storage of previously acquired knowledge. Subsequently, this led to interest in autobiographical memory: the access of specific memories and the level of detail at which they can be recollected. Findings from Corkin (1984) showed that H.M. could produce well-formed autobiographical memories from the age of 16 and younger. As H.M. aged, the situation changed. In his later life (76 years old), his memories were more of a factual recall than memories of specific episodes. Moreover, it was found that he could not narrate any single event occurring at a specific time and place. It was concluded that memory for autobiographical events is highly dependent on the MTL, so long as the memories persist.
There have been a few contradictions from researchers more recently. In 2002–2003, MRI scans were taken of H.M.’s brain (Salat et al., 2006). The scans documented new changes since H.M.’s first MRI scans (1992–1993). These new findings included cortical thinning, subcortical atrophy, abnormal white matter and subcortical infarcts. These new findings complicated neuropsychological interpretations collected during the same timeframe. Another consideration is that remote memories may have been intact during the early years following surgery, but then could have faded with time. This would be a result of an inability to be strengthened via rehearsal and relearning.
It was concluded, overall, that memories from early life remain intact unless the damage sustained extends into the lateral parts of the temporal lobe and even the frontal lobe. The structures damaged in H.M. are interpreted as important in the formation of LTM and its maintenance for a period of time after learning. During this period, it is thought that gradual changes occur in the neocortex (responsible for memory consolidation) that increase the complexity, distribution and connectivity among multiple cortical regions. Thus, it has been suggested that, over time, memory is supported by the neocortex and not the MTL.
H.M. sparked and motivated an enormous amount of research, both in humans and animals, on the topic of remote memory, and still, today, continues to stimulate discussion about the nature and significance of retrograde amnesia.
References
Baddeley, A.D. & Warrington, E.K. (1970). Amnesia and the distinction between long- and short-term memory. Journal of Verbal Learning and Verbal Behaviour, 9 (2), 176–189.
Cohen, N.J. & Squire, L.R. (1980). Preserved learning and retention of pattern-analysing skill in amnesia: Dissociation of knowing how and knowing that. Science, 210 (4466), 207–210.
Corkin, S. (1984). Lasting consequences of bilateral medial temporal lobectomy: Clinical course and experimental findings in H.M. Seminars in Neurology, 4, 252–262.
Milner, B. (1962). Physiologie de l’hippocampe. In P. Passouant (ed.), Centre National de la Recherche Scientifique (pp. 257–272). Paris: Centre National de la Recherche Scientifique.
Sanders, H.I. & Warrington, E.K. (1971). Memory for remote events in amnesic patients. Brain, 94, 661–668.
Salat, D.H., van der Kouwe, A.J.W., Touch, D.S., Quinn, B.T., Fischl, B., Dale, A.M. & Corkin, S. (2006). Neuroimaging H.M.: A 10-year follow-up examination. Hippocampus, 16, 936–945
Squire, L.R. (2009). The legacy of patient H.M. for neuroscience. Neuron, 15 (6), 6–9.
Research activity
RESEARCH ACTIVITY: Word-stem completion task
DownloadFor this exercise it is important that you follow the instructions carefully and that you are NOT tempted to scroll forward at any point.
Phase 1
Instructions: Please read the following text through once only:
The house stands on a hill overlooking the waters of the river Agua. Its occupants are a city broker and his friend, both soon to retire. They both share an interest in this region of Spain, having spent many a joyful holiday here. Just six more months of work back home and they will be out here for a good amount of time each year, rather than the odd weekly visit. They like the peace and the slow pace of life here compared to the hustle and bustle of central London, where they have lived for the past 20 years. The cost of living is also much better here and their pension will go much further.
Phase 2
Below are 12 word stems, each beginning with three letters, with the last three letters missing. Your task is to complete the words to make real words, but you must NOT use any word that was present in the previous text. DO NOT cheat or reread that text! Write out your answers on a spare piece of paper.
STA _ _ _
WAT _ _ _
FRI _ _ _
RET _ _ _
REG _ _ _
JOY _ _ _
MON _ _ _
AMO _ _ _
RAT _ _ _
BUS _ _ _
LIV _ _ _
BET_ _ _
Once completed, go to the next phase
Phase 3
Your next task is to study the following 12 words for 2 minutes.
Detour
Thrown
Entail
Trance
Locate
Potent
Series
Tender
Ration
Leaves
String
Beaker
After 2 minutes have passed, go to the next phase.
Phase 4
Below are 12 word stems, each beginning with three letters, with the last three letters missing. Your task is to complete the words to make real words, but you must NOT use any word that was present in the previous list. DO NOT cheat or reread that list! Write out your answers on a spare piece of paper.
DET _ _ _
THR _ _ _
ENT _ _ _
TRA _ _ _
LOC _ _ _
POT _ _ _
SER _ _ _
TEN _ _ _
RAT _ _ _
LEA _ _ _
STR _ _ _
BEA _ _ _
You may now check your answers. In Phase 2, score 1 point for each word you completed that is contained in the text passage. Also, for Phase 4, score 1 point for each word you completed that exists in the list.
Rationale: What is this activity about?
Jacoby et al. (1993) devised a method to tease apart the two influences of conscious and non-conscious processes in memory. The assumption is that both processes are involved separately during learning, and that if conscious processes are inhibited then the result on some recall tasks must be the influence of non-conscious processing.
The stem-completion task you carried out above is usually conducted under four conditions. The stimuli can be presented in conditions in which attention is either highly focused (optimal condition) or only partially focused (suboptimal condition) on the words presented. The task carried out is stem completion – either trying to complete the stems using the words presented (inclusion task), or trying to complete them by NOT using the words presented (exclusion task). The four conditions are shown in the table below.
Word presentation |
||
Optimal |
Suboptimal |
|
Inclusion |
Complete word stems to make previously seen words Correct inclusion implies conscious retention of the words |
Complete word stems to make words previously shown suboptimally, such as while doing a distractor task or words presented very briefly Correct inclusion implies non-conscious retention of the words |
Exclusion |
Complete word stems but don’t use any word shown previously Correct exclusion implies conscious retention of the words |
Complete word stems but don’t use any word shown previously at suboptimal levels, such as while doing a distractor task or words presented very briefly Incorrect exclusion implies non-conscious retention of the words |
Note that the key condition is suboptimal exclusion. If participants complete word stems using the suboptimally presented words when instructed NOT to use those words, then this implies that a non-conscious or implicit process is at work during the task.
Phases 1 and 2 above were designed to be an exclusion task with a suboptimal prime. Since the words were embedded within a story, it is likely that you did not pay particular attention to individual words, but rather to the overall meaning of the text. Therefore the presentation of the target words could be considered suboptimal. In contrast, Phases 3 and 4 represent an exclusion task with an optimal prime. The words were presented individually, and you were given a sufficient amount of time to attend to them.
Your data
Score your work for Phases 1 and 2, and then Phases 3 and 4. Give yourself 1 point each time you completed a word stem by using a word previously shown (that is, when you failed to exclude a given word). Ignoring any word stem that you could not complete, calculate the percentage of exclusion failures for each task. Thus, if in Phases 1 and 2 you failed to exclude two words in the task, correctly excluded six words in completing the word stems, but could not complete the word stem in two cases, then your percentage score would be 2/6, or 33%.
Predictions
Explicit and implicit memory systems are both thought to be in operation during learning. The exclusion–inclusion task devised by Jacoby et al. (1993) is one way in which the relative contribution of either process may be isolated. In line with previous research, the predictions of the data obtained in this exercise are that: (1) incorrect exclusions with the optimal prime (Phases 3 and 4) should be lower than those with the suboptimal prime (Phases 1 and 2); and (2) there should be some failures to exclude with the suboptimal prime – this is because of your implicit, non-conscious processing of the target words.
Questions
- If you failed to exclude in the suboptimal condition, can you think of a reason why that might not involve the concept of implicit memory?
- One criticism of this approach is that participants use a generate-and-test rule. That is, they generate a possible stem completion and then test their memory to see if it was in the list. This might mean that explicit processes are not independent of implicit processes. Did you use the generate-and-test method?
- Can you think of other ways of presenting words suboptimally?
- What do you think are the key factors (about the way the stimuli could be presented suboptimally) that might be important when someone fails to exclude an item?
- What might cause a failure to exclude in the optimal condition? Could a failure to exclude in the suboptimal condition be explained in the same way?
Reference
Jacoby, L.L., Toth, J.P. & Yonelinas, A.P. (1993). Separating conscious and unconscious influences of memory: Measuring recollection. Journal of Experimental Psychology: General, 122, 139–154.
Flashcards
Quiz
Chapter 8
Case study
CASE STUDY: Cognitive interview, eyewitness confidence and recall in older adults
DownloadThe cognitive interview is a retrieval-based mnemonic technique often used to help individuals recall specific events that might have occurred to which they were witness. While there is a considerable amount of research showing that the cognitive interview can enhance eyewitnesses’ recall for an event, particularly in children, little attention in its application has been demonstrated in the older adult population, and, based on previous findings, the benefit to older adults is unclear. Moreover, there has been a considerable amount of research investigating the relationship between confidence and accuracy in recall, however little of this research has focused on recall following the cognitive interview.
Several studies have attempted to address this by showing participants a film of a kidnapping or a robbery, and then comparing the data collected through either the cognitive interview or a standardised police interview. One such study is Granhag et al. (2004). In their study participants were shown a film of a kidnapping. Interviews were conducted two weeks later, and the study included a control condition in which participants viewed the film but were not interviewed. All participants completed a questionnaire that asked about factual details in the film; a confidence rating was also required on each of their answers.
The study’s main finding showed no differences in the accuracy of answers between any of the three conditions. However, there was a significant increase in confidence in their answers for the two interview conditions compared with the no-interview condition.
In a similar study by Mello and Fisher (1996), 30 older adults and 20 young adults (a total of 50 participants) were shown a videotape of a simulated crime and were then interviewed with either a cognitive interview or a standard interview. Within the older adults’ condition, interviews were a cognitive interview, a standard interview or a modified cognitive interview. Results showed no differences between the cognitive interview and the modified cognitive interview. Results also indicated that the cognitive interview elicited more information than the standard interview, without a decrease in accuracy rate. In addition, the cognitive interview demonstrated an advantage for the older (rather than younger) participants, compared to the standard interview. No age-related differences were recorded.
In a further study by McMahon (2000), participants viewed a film of a simulated armed robbery and were required to recall the events they had seen. Memory performance was investigated in relation to total correct, incorrect and confabulated information recalled about key aspects of the crime and the offenders. Like Granhag and colleagues (2004), participants had to provide a confidence rating. Results indicated no significant differences for recall of correct, incorrect and confabulated information in the cognitive interview and structured interview conditions. As expected, younger adults recalled significantly more correct information than the older adults, despite no differences, significantly, between age groups in the amount of incorrect information recalled or the number of confabulations. Confidence of recalled information was not found to significantly relate to age or interview condition.
A study by Dornburg and McDaniel (2006) offered advances on the research by McMahon (2000) and Mello and Fisher (1996). Participants were given a brief verbal overview of a story, they then read the same story on a computer, and they were then required to complete a short demographic questionnaire. While filling out the questionnaire the researchers told each participant discordant information about the relationships within the story – for example, “As it turns out, they did get married.”
There was a three-week delay, after which control participants were told to recall the story as best they could without including personal feelings or reactions to the story. Instructions were repeated and participants were given 10 minutes in which to recall the story. The story was recalled a total of three times.
After the three-week delay, cognitive interview participants were instructed to recall (written form) as much information as possible without the addition of confabulations or inclusion of personal feelings. Like the control group, three recall attempts were made in a 10-minute time frame. However, unlike the control group, the cognitive interview group were asked to do certain things during their recall. For the first recall, they were asked to contextualise the environment preceding their reading of the story. For the second recall attempt, they were to think about the events subsequent to their reading of the recall and to use this knowledge to guide their backward recall of the story. Before their third attempt, they were asked to consider the researchers’ perspectives during the first session and to use that as a guide for their final recall. They were then asked to confidence rate what they had recalled. Like McMahon (2000) and Mello and Fisher (1996), results from this study showed that the cognitive interview effectively increased the older adults’ recall relative to the standard recall instructions three weeks later.
These studies highlight important implications for the use of the cognitive interview in eyewitness testimony, especially when dealing with older adults. Granhag et al. (2004) explained their findings in terms of a ‘reiteration effect’. By talking about the film through the interview, the participants’ levels of confidence naturally increased. This phenomenon cannot be explained by the mental reinstatement of context as is normally claimed by supporters of the use of cognitive interview. Moreover, results by Dornburg and McDaniel support this concept of ‘reiteration’. As expected, given the literature on ageing, the significant main effect of retrieval attempt demonstrates that the use of repeated testing provided some benefit for older adults in both recall instruction groups. While accuracy rates slightly decreased with each retrieval attempt, it suggests that repeated recall alone is not as useful a component for older adults when combined with other interviewing techniques. However, despite this, their results did indicate the usefulness of the cognitive interview for older adults even with contextually poor stimuli following a long delay.
Although consistent, findings such as these can be problematic for the cognitive interview method because it neither improves nor impairs the realism in eyewitness confidence when compared with the standard interview. One problem with these studies is that there are likely to be important differences in the way people respond to a real event unfolding in front of them, compared to watching a film in a comfortable and safe environment. These differences may have a large effect on the way the information is stored and retrieved, and in turn on the way the two different types of interviewing techniques can impact on the level of confidence of an eyewitness.
Further research is needed to explore whether the beneficial effects of the cognitive interview noted in earlier research are limited to recall after periods of delay longer than those used within these studies (30 minutes, 3 weeks). It would also be of interest to compare the effectiveness of the cognitive interview against a control interview. The control interview would share social dynamics and interaction of the cognitive interview but would lack its mnemonic strategies.
References
Dornburg, C.C. & McDaniel, M.A. (2006). The cognitive interview enhances long-term free recall of older adults. Psychology and Aging, 21 (1), 196–200.
Granhag, P.A., Jonsson, A.C. & Allwood, C.M. (2004). The cognitive interview and its effect on witnesses’ confidence. Psychology, Crime & Law, 10, 37–52.
McMahon, M. (2000). The effect of the enhanced cognitive interview on recall and confidence in elderly adults. Psychiatry, Psychology and Law, 7 (1), 9–32.
Mello, E.W. & Fisher, R.P. (1996). Enhancing older adult eyewitness memory with the cognitive interview. Applied Cognitive Psychology, 10 (5), 403–417.
Research activity
RESEARCH ACTIVITY: Memory for personal events
Download1. Write down eight events from your life using the following prompts:
- Two very important events that you can recall vividly.
- Two very important events that you can’t recall too clearly.
- Two trivial events that you can recall vividly.
- Two trivial events that you can’t recall too clearly.
2. Next, for each event, write down the date as accurately as you can. Ideally, this should be the day of the month, the month and the year, but if you can only recall the year then this will do.
3. Finally, for each event, write down how you worked out the date it happened.
Rationale
People are generally very accurate at recalling the date of an event, at least approximately. How do we remember when past events happened? According to Conway and Bekerian (1987), people often relate the events of their lives to major lifetime periods. We also sometimes draw inferences about when an event happened on the basis of how much information we can remember about it: if we can remember very little about an event, we may assume it happened a long time ago. This idea was tested by Brown et al. (1985). People dated several news events over a 5-year period (1977 to 1982). On average, those events about which much was known (e.g., the shooting of President Reagan) were dated as too recent by over three months, whereas low-knowledge events were dated as too remote by about three months.
Questions
- Did you use knowledge of important public events in dating your memories?
- Did you use knowledge of important events from your life?
- Did you use a different strategy for the important events you listed, compared to the trivial events you listed? If so, can you explain why a different strategy was needed?
- Did you use a different strategy for the vivid memories compared to the less vivid memories? Again, if so, can you explain why a different strategy was needed?
References
Brown, N.R., Rips, L.J. & Shevell, S.K. (1985). The subjective dates of natural events in very-long-term memory. Cognitive Psychology, 17, 139–177. [doi: 10.1016/0010-0285(85)90006-4]
Conway, M.A. & Bekerian, D.A. (1987). Organization in autobiographical memory. Memory & Cognition, 15, 119–132.
Flashcards
Quiz
Chapter 9
Case studies
CASE STUDY: Categorical perception in American Sign Language
DownloadWhen we listen to a speaker of our native language, we tend not to hear a continuous flow of sound (which it mostly is) – rather, we perceive the utterance as distinct units. Anyone trying to learn a second language is likely to have found that when spoken by a native of the language it sounds like a continuous flow of sounds.
The perception of speech as distinct units rather than as a continuous stream is known as categorical perception and has mostly been studied using speech. However, Emmorey et al. (2003) studied categorical perception in users of American Sign Language (ASL). The experiments compared deaf signers and hearing non-signers on ASL.
There are three important aspects to ASL: hand configuration, place of articulation and movement. The first refers to the configuration of the hands and fingers, the second refers to the location of the hands about the body and the third refers to the movement of the hands and arms. However, not all hand configurations and places of articulation are distinctive in ASL. The author hypothesised that deaf signers, but not hearing non-signers, would show categorical perception for distinctive hand configurations and places of articulation.
A computer program was used to generate a continuous movement of the hands from one sign to another; for example, from PLEASE, signed by showing the back of the hand with thumb and four fingers extended, to SORRY, which is signed in a similar way but with only the thumb extended (see figure below). Two tasks were used: a discrimination task and a categorical task.
For the discrimination task, eleven images or frames were created for each word pair (e.g., the signs for PLEASE and for SORRY, and nine equally spaced intermediate images). Participants were presented with two images that were two frames apart, and then a third image that was either identical to the first or second image. The task was to identify whether the third image was the same as the first image or the second image.
 Example of two signs used in the study.
For the categorisation task, subjects were shown the two signs (the two end points on the continuum) and then one further sign, which was a randomly chosen image from the eleven. Participants had to say (in a forced-choice paradigm) whether the image represented one or other of the two signs (end points).
The results showed that deaf signers showed a categorical perception effect with the discrimination task, but the hearing non-signers did not. Neither group showed categorical perception with the categorical task. This was determined by comparing responses at the category boundary, where deaf signers showed a significantly higher accuracy in the task than hearing non-signers.
This study shows that categorical perception is not unique to speech processing but can occur in ASL. Thus, the categorical perception may “arise naturally as a part of language processing, whether that language is signed or spoken” (Emmorey et al., 2003, p. 39).
Reference
Emmorey, K., McCullough, S. & Brentari, D. (2003). Categorical perception in American Sign Language. Language and Cognitive Processes,18 (1), 21–45.
CASE STUDY: Are syllables phonological units in visual word recognition?
DownloadIn word recognition it has been claimed that we do not process words as single units, but rather in sub-lexical units, such as syllables. Evidence for this comes from studies in reading times in which words that contain high-frequency syllables take longer to read than words with low-frequency syllables. This effect is interpreted by supposing that high-frequency syllables activate more potential word representations in memory than do low-frequency syllables. Such syllabic effects in word recognition are thought to utilise the phonological loop in working memory. One problem with this general view is that syllabic effects tend to be found in Spanish and French, but not in English.
The experiments reported in Álvarez and Carreiras (2004) were aimed at studying the syllabic effect and its possible relationship with phonological representations. The method used a masked priming procedure in which a mask (a row of five hash marks – #####) was presented for 500 ms, followed by a non-word in lower case (the prime word) for 64 ms, which was then replaced by a word in upper case (the target word). The participants, who were native Spanish speakers, were instructed to decide whether the target word was a legitimate Spanish word or not (by pressing one of two response keys). The expectation of such a design is that if the prime and target share the same initial syllable, then the response time will be longer than when the initial syllable of the prime and the target are different. This would be taken as evidence that syllables play an important role in word recognition. This was indeed found in experiment 1, as a substantial priming effect was obtained when words shared the same initial syllable. In a second condition, when words shared the same letters (orthographic similarity) but not the same first syllable, no priming effect was found. This might suggest that syllables are processed phonologically, but the authors concede that this is not conclusive.
In experiment 2 the phonological structure of the prime–target pairs was held constant, but the orthographic structure was manipulated. In Spanish, the pronunciation of the letters v and b is the same. So, although the words virel and birel are pronounced the same way, they are orthographically different. By taking advantage of this aspect of the Spanish language, the authors argue that it may be possible to investigate whether there is an interaction between syllabic structure and phonological similarity in word recognition. In fact, the results showed that syllabic effects appeared for the conditions in which there was phonological and orthographic prime–target similarity (e.g., gesta–geser, that is, the first syllables are spelled and pronounced the same way), as well as in the condition in which there was only a phonological similarity between the prime and the target (e.g., gesta–jeser, that is, the first syllables are spelled differently but they are pronounced the same way). This suggests syllabic effects depend more on phonological word structure and less on orthographic structure.
Finally, in the third experiment, a phonological similarity condition, such as valis–balón, in which the first two syllables are pronounced in the same way but are spelled differently, was compared with one control condition in which the first syllables rhymed but the first consonants were different (e.g., falis–balón), and a second control condition in which the prime and target words shared the first three phonemes (e.g., bal), but not the first syllable (e.g., valti–balón, in which the stress on the prime is on the first vowel, and the stress on the target is on the second vowel). The results were that a priming effect was obtained for the phonological condition but not in the two control conditions. The authors conclude that syllabic structures are processed phonologically rather than orthographically. The results rule out the possibility that graphemes are recoded phonologically (e.g., B and b being perceived as graphemically equivalent because they are pronounced the same way) because of the use of v/b prime–target pairs in which a significant priming effect was found.
The results are consistent with models of reading that assume early and automatic activation of word phonology. However, these models may need revision to take account of phonology at the syllabic level, as suggested by these experiments.
Reference
Álvarez, C.J. & Carreiras, M. (2004). Are syllables phonological units in visual word recognition? Language and Cognitive Processes, 19, 427–452. [doi: 10.1080/769813935]
Flashcards
Quiz
Chapter 10
Case study
CASE STUDY: Bartlett – “The War of the Ghosts”
DownloadHow can we show the impact of prior knowledge or schematic knowledge on memory? Bartlett (1932) asked people to learn material producing a conflict between what was presented and the reconstructive processes based on knowledge of the world. If, for example, people read a story taken from a different culture, then prior knowledge might produce distortions in the remembered version of the story, making it more conventional and acceptable from the standpoint of their own cultural background.
In his 1932 study, Bartlett asked his English participants to read a North American Indian folk tale called “The War of the Ghosts”, after which they tried to recall the story. Part of the story was as follows:
One night two young men from Edulac went down the river to hunt seals, and while they were there it became foggy and calm. Then they heard war-cries, and they thought: “Maybe this is a war-party.” They escaped to the shore and hid behind a log. Now canoes came up, and they heard the noise of paddles, and saw one canoe coming up to them. There were five men in the canoe, and they said: “What do you think? We wish to take you along. We are going up the river to make war on the people.”
… one of the young men went but the other returned home … [it turns out that the five men in the boat were ghosts and after accompanying them in a fight, the young man returned to his village to tell his tale] … and said: “Behold I accompanied the ghosts, and we went to fight. Many of our fellows were killed, and many of those who attacked us were killed. They said I was hit, and I did not feel sick.”
He told it all and then he became quiet. When the sun rose, he fell down. Something black came out of his mouth. His face became contorted … He was dead. (p. 65)
One of the subject’s recall of the story (two weeks later):
There were two ghosts. They were on a river. There was a canoe on the river with five men in it. There occurred a war of ghosts … They started the war, and several were wounded, and some killed. One ghost was wounded but did not feel sick. He went back to the village in the canoe. The next morning, he was sick and something black came out of his mouth, and they cried: “He is dead.” (p.76)
Bartlett found the participants’ recalls distorted the content and style of the original story. The story was shortened, and the phrases, and often words, were changed to be closer to the English language and concepts (e.g., “boat” instead of “canoe”). He also found other kinds of errors, including flattening (failure to recall unfamiliar details) and sharpening (elaboration of certain details).
A criticism of Bartlett’s work was that his approach to research lacked objectivity. Some psychologists believe that well-controlled experiments are the only way to produce objective data. Bartlett’s methods were somewhat casual. He simply asked his group of participants to recall the story at various intervals and there were no special conditions for this recall. It is possible that other factors affected their performance, such as the conditions around them at the time they were recalling the story, or it could be that the distortions were simply guesses by participants who were trying to make their recall seem coherent and complete rather than genuine distortions in recall.
Alternatively, one could argue that his research is more ecologically valid than those studies that involve the recall of syllables or lists of words. In recent years there has been an increase in the kind of research conducted by Bartlett, looking more at “everyday memory”.
Practical implications of reconstructive memory
Bartlett’s work has been highly influential, particularly in terms of eyewitness testimony. His reconstructive memory theory is crucial to understanding the reliability of eyewitness testimony: recall is subject to personal interpretation depending on the information learned, cultural norms and values, and the way we make sense of the world. One way Bartlett explained this concept was in terms of schemas: the information stored in that way is what makes the most sense to the individual storing that information. As a consequence of being determined by social values, which may lead to prejudicial thoughts, schemas are highly capable of distorting unfamiliar or unconsciously “unacceptable” information. This has implications when it comes to eyewitness testimony, which may be deemed unreliable.
Bartlett’s study (1932) “War of the Ghosts” showed that memory is not just a factual recording of what has occurred, but individuals make the effort to remember in terms of what they know and understand about the world. Consequently, we often change our memories, so they become more coherent to us. The story itself was recalled differently, each person reciting it in their own way. With repetitive telling, passages became short, ideas that did not make sense were rationalised or removed and details changed to become more familiar or conventional. This is a key finding that suggests each of us reconstructs our memories to conform to our personal beliefs about the world. Thus, our memories are anything but reliable.
In a given context, such as an eyewitness’s account of an event involving a weapon (where the weapon is the focus of the event), the concentration on the weapon often makes them exclude other important details of the crime. It is, therefore, not unusual for a witness to be able to describe the weapon in greater detail than the perpetrator holding the weapon. One of the foundations of reconstructive memory experiments is the work of Loftus and colleagues (1987). In their study, a series of slides of a customer in a restaurant were shown to participants. In one condition, the customer was holding a gun, and in the other condition, the same customer was holding a cheque book. Participants who saw the customer with the gun, focused more on the gun than the customer. Consequently, they were unable to produce a reliable description of the customer and were less likely to pick them out from a line-up, compared to those that saw a cheque book instead. This has major implications when questioning a witness in relation to a crime that has weapons involved.
Reference
Bartlett, F.C. (1932). Remembering: A study in experimental and social psychology. Cambridge: Cambridge University Press.
Loftus, E.F., Loftus, G.R. & Messo, J. (1987). Some facts about “weapon focus”. Law and Human Behaviour, 11, 55–62.
Research activities
RESEARCH ACTIVITY: Text comprehension and inference drawing
DownloadThe following text is taken from Talking Heads by Alan Bennett (“A chip in the sugar”, p. 16). This text is used to illustrate the inferences that we make during reading. We make some of these inferences instantly, while others require a little more thought.
The passage is broken down into groups of one or two sentences, each group followed by a few questions. Answer each question by referring to the text you have just read (and not by scanning later sections of the text). After you have answered a question, also write down how you arrived at the answer (or how you drew your inference).
“I’d just taken her tea up this morning when she said, ‘Graham, I think the world of you.’”
- What might the relationship between the person referred to as “she” and Graham be; sister–brother, wife–husband, mother–son, or friends?
- Is “she” a child or an adult?
- Where do you think “she” is?
- Are Graham and the narrator the same person?
- Is the “tea” a drink or a meal?
- What does the text imply about her state of health?
- How might the word “you” be spoken; with rising or falling tone?
- Do you think this is the first time that the narrator has said this to her?
- What is the narrator referring to with the word “this”?
- What is the clue the narrator uses to infer how she feels?
- Has she sipped any of the tea yet?
- What colour is the tea; light or dark brown?
- Are the curtains open or closed?
- Is the colour of the tea affected by the light in the room?
- What is meant here by the term “Number One”?
- What does “it” refer to?
- What thing might “a bit of Mother’s past” refer to?
- What does the term “we ran into” imply?
- Who might “he” be a reference to?
- In what context are the two speakers using the word “past”?
- What is the relationship between the two, and has your view changed since question 1?
- Is Dad alive or dead?
- What does the laugh imply?
- How many years ago might the “pre-Dad” relationship have taken place?
- Why is “that different”?
“I said, ‘I think the world of you.’”
“And she said, ‘That’s all right then.’ I said, ‘What’s brought this on?’”
“She said, ‘Nothing. This tea looks strong, pull the curtains.’ Of course I knew what had brought it on.”
“She said, ‘I wouldn’t like you to think you’re not Number One.’”
“So I said, ‘Well, you’re Number One with me too. Give me your teeth. I’ll swill them.’ What it was we’d had a spot of excitement yesterday: we ran into a bit of Mother’s past.”
“I said to her, ‘I didn’t know you had a past. I thought I was your past.’ She said, ‘You?’ I said, ‘Well, we go back a long way. How does he fit in vis-à-vis Dad?’”
“She laughed. ‘Oh, he was pre-Dad.’”
“I said, ‘Pre-Dad? I’m surprised you remember him, you don’t remember to switch your blanket off.’ She said, ‘That’s different. His name’s Turnbull.’ I said, ‘I know. He said.’”
The questions highlight 25 possible inferences from this short passage. Read the text again and see if you can identify any more information that can be inferred from it. Also, try to decide what type of inference each is from the following categories:
A logical inference depends only on the meaning of words.
A bridging inference needs to be made to establish coherence between the current part of the text and the preceding text.
An elaborative inference serves to embellish or add details to the text.
RESEARCH ACTIVITY: Inferences – which theory is supported by the most evidence?
DownloadStudy the table below. Which theory is supported by the most evidence?
Type of inference |
Answers query |
Predicted by search-after-meaning theory? |
Predicted by minimalists? |
Normally found? |
1. Referential |
To what previous word does this apply? (e.g., anaphora) |
Yes |
Yes |
Yes |
2. Case structure role assignment |
What is the role (e.g., agent, object) of this noun? |
Yes |
Yes |
Yes |
3. Causal antecedent |
What caused this? |
Yes |
Yes |
Yes |
4. Supraordinate goal |
What is the main goal? |
Yes |
Yes |
|
5. Thematic |
What is the overall theme? |
Yes |
? |
|
6. Character emotional reaction |
How does the character feel? |
Yes |
Yes |
|
7. Causal consequence |
What happens next? |
No |
||
8. Instrument |
What was used to do this? |
No |
||
9. Subordinate goal-action |
How was the action achieved? |
No |
Adapted from: Graesser, A.C., Singer, M. & Trabasso, T. (1994). Constructing inferences during narrative text comprehension. Psychological Review, 101, 371–395.
Flashcards
Quiz
Chapter 11
Research activities
RESEARCH ACTIVITY: Discourse markers
DownloadThe purpose of this exercise is to understand the use of discourse markers and how they can enhance meaning in written and spoken language. In written language they are used to draw attention to a specific point in the sentence that follows. In spoken language they are used for the benefit of the listener, in order to clarify the role of a phrase in the dialogue that follows. Discourse markers in written and spoken language therefore serve similar roles, except that in spoken language they are less formal and less well planned by the communicator.
Formal (written) discourse markers:
Although
As a result
Moreover
On the other hand
While
Nonetheless
In addition
With regard to
However
Therefore
Informal (spoken) discourse markers:
By the way
Anyway
Well
You know
Actually
And then
Oh
Um
Exactly
To tell you the truth
Using the lists of discourse markers above (and any others that spring to mind), create two sentences, one with a formal and one with an informal discourse marker, from each of the following:
__________ the latest A-level results, we can see that there is an overall improvement of 5% on last year’s figures.
__________, taller people tend to receive more respect than shorter people.
__________ I enjoy smoking, I know it’s bad for me.
__________, horse riding can be dangerous.
__________, no one can stop him doing it.
__________, it’s not just cricket she’s good at, she’s an excellent car mechanic.
__________, the service also suffers in its delivery of customer services.
__________ we disagree a lot, I still like him.
__________, you should not count your chickens before they are hatched.
__________, the study proves very little in the way of how children learn the rules of grammar.
__________, her mother called me last night.
__________, I said that I had had enough of this nonsense.
RESEARCH ACTIVITY: Knowledge-telling and knowledge-transforming strategies
DownloadChoose a paragraph from one of your own essays that is “knowledge-telling” and try to convert it to “knowledge-transforming” text. This will involve thinking more analytically about your knowledge and transforming it so that it engages more deeply with the essay question.
The example below shows different strategies for performing the same outlining task.
TASK: Write an outline for a travel article on San Francisco
Knowledge-telling strategy |
Knowledge-transforming strategy |
|
Theme of article: diversity of city caused by:
|
Case studies
CASE STUDY: Working memory components in written sentence generation
DownloadBaddeley (1986) proposed a working memory model composed of three distinct components: phonological loop, visuo-spatial sketchpad and a central executive. It is now believed the model should include a fourth component, the episodic buffer (2000). Current evidence suggests that the visual, spatial and semantic stores are separate from the verbal store. The role of these components in written sentence production is unexplored and is the focus of Kellogg’s (2004) study.
There were two aims of Kellogg’s research. The primary aim was to establish the memory load condition under which a reduction in sentence length is reliably obtained. It was predicted that verbal load would disrupt sentence generation, and not the visual and spatial components of working memory. The second aim was to explore at which stage processing is responsible for sentence length effect. An effect of prompt relatedness and sentence complexity was expected in initiating a sentence.
The first experiment required participants (university students) to write a meaningful sentence as quickly as possible. On each trial, two nouns were given as prompts. On most trials, participants were asked to perform a memory task at the same time (for example, to remember certain digits). Next, on each trial, a sentence appeared on the computer and participants were instructed to copy it as quickly and accurately as possible. They were instructed to correct typographical errors as they typed but were not allowed to go back and fix the remaining errors once they reached the end of the sentence. A total of 20 trials were given to assess typing speed.
The purpose of the second experiment was to check whether the letter/image condition involved verbal rather than visuo-spatial working memory. In this experiment, a total of 72 participants were randomly assigned with three conditions. The simple sentence instructions of Experiment 1 were used in all three conditions in Experiment 2. In the random image condition, five images were substituted for letters used in the letter/image condition. Another difference was that on 6 of 20 trials per block, a third word appeared on the screen below the two given prompt nouns. Participants were told to monitor their screen for the extra word, to hit enter as soon as it appeared and to reformulate a new sentence that included all three words.
The overall results from the two experiments suggested that only a six-digit load reliably reduced sentence length relative to the control; truncating sentence length was mirrored in a shorter typing time. This suggests that unimpeded sentence generation and sentence length requires verbal working memory, and not the executive functions needed in all dual-task conditions. However, it has been argued that the six-digit task increased the demands placed on the executive and verbal components of working memory. Subsequently, sentence-length effect can be explained in terms of failure to retrieve and maintain lexical representations during grammatical encoding. In particular, when the load on verbal working memory was large, grammatical encoding was deemed “automatic” and “modular”. However, memory load results showed no effect on grammatical and spelling errors, implying that syntactic and orthographic processing was undisturbed. Furthermore, when asked to generate multiple clauses in the complex sentence condition, participants did equally well with no load or heavy load on verbal working memory.
In conclusion, verbal working memory appeared necessary for lexical processing, but other aspects of grammatical encoding were exempt to the effects of retaining six digits concurrently. Taken together with the trend observed in spoken production, and the reliable difference reported in text production, it has been established that a six-digit load on verbal working memory disrupts lexical processing. Varying alternative explanations have been put forward: disruption to planning in semantic working memory, phonological or orthographic encoding disruptions.
References
Baddeley, A. (1986). Working Memory. New York: Clarendon Press/Oxford University Press.
Baddeley, A. (2000). The episodic buffer: A new component of working memory? Trends in Cognitive Sciences, 4 (11), 417–423.
Kellogg, R.T. (2004). Working memory components in written sentence generation. The American Journal of Psychology, 117 (3), 341–361.
CASE STUDY: Differences in spelling ability between deaf and hearing students: syllables, letter frequency and speech
DownloadStudies of how deaf individuals process written language can tell us a lot about the underlying linguistic processes of deaf people, but it can also be useful for understanding general human linguistic capabilities. In terms of orthography and phonology (the written and spoken aspects of language), theorists differ as to their relative importance. The aim of the present study (Olson & Caramazza, 2004) was to provide a comparison of the spelling abilities of deaf and hearing individuals in order to shed more light on the issue.
The spelling abilities of 23 deaf students and 100 hearing students for 341 words were analysed in this experiment. Deaf students are more likely to have learned English orthography with an attenuated experience of speech (although lip-reading can give some clues as to phonology), so it was predicted that their spelling errors would be less phonologically plausible than those of hearing students.
The results were that the deaf students made slightly more spelling errors than hearing students (15% vs 10%). A classification of the types of errors made reveals that deaf students made many more errors that are phonologically implausible than did hearing students (73% vs 20%). Examples of these phonologically implausible errors are: responsible–responbile, secret–secert, scissors–sicossics and medicine–medince. Examples of spelling errors made by hearing students include, responsible–responsable, secret–secrete, scissors–sciccors and medicine–medican. The implication is that deaf students’ spelling is less influenced by phonology than is the spelling of hearing students. There are then many gaps in deaf students’ knowledge of English phonology.
Reference
Olson, A.C. & Caramazza, A. (2004). Orthographic structure and deaf spelling errors: Syllables, letter frequency, and speech. The Quarterly Journal of Experimental Psychology, 57A: 385–417.
Flashcards
Quiz
Chapter 12
Case studies
CASE STUDY: Recording the eye movements of expert chess players
DownloadWhy are some people so very much better at chess than others? One possibility is that better players have more efficient cognitive processes, such as working memory or intelligence. However, the classic studies by De Groot (1946) on skilled performance showed that chess experts do not have superior general cognitive processes, but rather have very specialised cognitive strategies. For example, expert chess players have better recall than novices for board game configurations, but not for random configurations. In addition, in searching for a move, the chess master makes use of better-organised long-term memory than do novices. Previous research has also examined the eye movements of chess experts and it has been found they pay more attention to empty board spaces than novices, suggesting they pay greater attention to the relations between chess pieces (Holding, 1985; Reynolds, 1982).
However, the previous studies examined frame-by-frame film sequences to extract eye-movement data and there is a question over the reliability of this method. Charness et al. (2001) studied the eye movements of expert chess players and compared them with less skilled, intermediate chess players. The aim of the experiment was to identify whether experts looked at empty squares more and fixated more on more salient pieces than non-experts (a salient piece is a chess piece that has greater importance for the current position in the game).
The researchers exploited new technology that enables a researcher to identify the precise location of an eye fixation on a computer screen every 4 ms. The system works by sending an infrared beam to the cornea and measuring its reflection. Details of the reflection indicate the direction of the eye and hence the location can be calculated. In each trial, expert chess players and intermediate chess players were given a board configuration and were asked to identify the best move as quickly as possible. There were five trials in all. The data recorded included reaction time, whether the solution was the best or not and the eye-fixation data.
The results showed that, as predicted, experts were faster and more accurate at identifying the best solution than intermediates. The fixation data revealed that experts made larger amplitude saccades (spatially larger eye movements), produced many more fixations on empty squares and produced a greater proportion of fixations on salient pieces than did intermediates.
The results imply that experts show more efficient encoding of the problem than do intermediates. This leads to “rapid recognition of salient relations among distant pieces, thereby enabling the player to focus on appropriate parts of the board. These processes set the stage for the generation of plausible moves that enable swifter and more accurate problem solving” (Charness et al., 2001, p. 1150). The finding that fixation on salient pieces occurs within the first 2 seconds supports the interpretation that experts also make greater use of peripheral vision than do intermediates. The findings are consistent with the view that perceptual skill gives an important advantage in chess. They also support the position of De Groot (1946/1978) that “one of the keys to skill in chess lies not in the thought processes that constitute search through the tree of move possibilities, but rather in the initial encoding of the relationships among the pieces in a chess position” (p. 1151).
The method used in this study allowed the researchers to identify that, for chess playing, important perceptual advantages, such as perceiving the relationships between the important pieces in a game, occur within the first few seconds.
References
Charness, N., Reingold, E.M., Pomplun, M. & Stampe, D.M. (2001). The perceptual aspect of skilled performance inches: Evidence from eye movements. Memory & Cognition, 29 (8), 1146–1152.
De Groot, A.D. (1946). Het denken van den schaker. Een experimenteel-psychologische studie. Amsterdam: Noord-Hollandsche Uitgeversmaatschappij.
De Groot, A.D. (1978). Thought and Choice in Chess (2nd edn). The Hague: Mouton.
Holding, D.H. (1985). The Psychology of Chess Skill. Hillsdale, NJ: Lawrence Erlbaum Associates.
Reynolds, R.I. (1982). Search heuristics of chess players of different calibres. American Journal of Psychology, 95, 383–392.
CASE STUDY: Brain areas involved in insight – the “aha!” moment of problem solving
DownloadThe aha! moment is the result of sudden comprehension that results in new interpretations of a situation and that can point to the solution of a problem. Insights occur as a result of restructuring or reorganising of situational elements or problem, although insight may occur in the absence of any pre-existing interpretation.
Insight has been an important researched phenomenon. It is a form of cognition that occurs in many domains, such as finding a solution to a problem. Insight can also bring meaning to a metaphor or joke, the identification of an object in an ambiguous picture, or realisation about oneself. Moreover, insight can contradict deliberate conscious search strategies that have been the centre of problem-solving research. Instead, insights occur when a solution is computed unconsciously and later emerges suddenly into awareness (Bowden & Jung-Beeman, 2003).
Furthermore, insight has often been identified as a form of creativity. It involves the reorganisation of conceptual thoughts, resulting in a new interpretation (Friedman & Förster, 2005). And, finally, insights can result in important innovations. By understanding the mechanisms of insight, it is possible to find methods that facilitate innovation (Kounios & Beeman, 2009).
Research into the neural correlates of insight have yielded significant and important findings. Such research has found activation in the temporal lobes, particularly the superior temporal gyrus, and parts of the prefrontal cortex (Jung-Beeman et al., 2004). These results would suggest that insight is among higher-order cognitive processes, such as task monitoring and semantic retrieval – core processes at the centre of the aha! moment. These findings align to models on insight (Knoblich et al., 2001; MacGregor et al., 2001). However, given that the aha! moment is typically associated with an affective state working in parallel with reward processing, it is expected that dopaminergic midbrain and associative brain structures are also involved (Tik et al., 2017).
Recent research has reported findings of subcortical area activation, including bilateral hippocampi, parahippocampal gyri and anterior and posterior cingulate cortex (Subramaniam et al., 2009). Furthermore, in a recent study by Kizilirmak et al. (2016) left hippocampal, parahippocampal and anterior cingulate cortex activation were found during insight. Additionally, event-related potential (ERP) results have also indicated anterior cingulate cortex activation as well as parahippocampal gyrus activation, suggesting both these structures are involved in problem solving (Qiu & Zhang, 2008).
A study by Tik and colleagues (2017) investigated insightful problem solving using fMRI. They used a 7-tesla scanner that allowed for high spatial resolution subcortical images. Their aim was to assess the activation in areas involved in insight and the feeling of certainty about a solution, and the formation of new memories and associations. Participants were required to carry out the remote associates test (RAT) while being scanned. This task allows for divergent thinking as well as convergent thinking, both of which are required for a successful RAT solution. During the RAT, participants were exposed to word triplets, and instructed to find a solution word being associated with all three given words. As soon as they felt confident in their solution without revision, participants were required to press a button, thus allowing the researchers to capture the exact occurrence of the aha! moment.
Their findings yielded strong and significant effects in many cortical and subcortical areas that are related to higher-level insight. Aside from the finding on cortical involvement of the left anterior middle temporal gyrus, Tik and colleagues also showed subcortical involvement of the bilateral thalamus, hippocampus and dopaminergic midbrain (comprised of the ventral tegmental areas, nucleus accumbens and caudate nucleus).
The results can be explained as followed. The nucleus accumbens is implicated in reward processing as it responds to pleasant stimuli or positive reinforcement, however, it is not restricted to processing primary rewards alone. This structure receives inputs from the hippocampus, amygdala and prefrontal cortex, and sends out information to the basal ganglia, dorsal thalamus and other midbrain structures. This means that the nucleus accumbens is in an ideal position to functionally integrate processes within the cortical and subcortical regions. Therefore, the activation seen within the nucleus accumbens within this study, may reflect the sudden jump to a solution followed by a moment of relief and confidence – all referred to as the aha! moment. Similarly, the head of the caudate nucleus has been associated to higher insight.
Previous research has linked the striatal pathway to cognitive flexibility. This means, strong activations in striatal areas associated to insight may correspond to RAT task demands and go in line with previous models of dopaminergic pathways and their involvement in different creative thinking demands. Recently, the dopaminergic midbrain structures have been recently linked with encoding of the expected certainty about a desired outcome (Schwartenbeck et al., 2014). Tik et al. (2017) found activation in the ventral tegmental area was strongly associated with solution finding. Activation in this area was high during highly insightful trials, which corresponds to the first-person phenomenology of certainty that is associated with moments of insight.
The middle temporal cortex (MTC) is an important cortical hub for insightful problem solving. Moreover, results from this study indicated activation of the left anterior MT gyrus, which has been linked to phonemic search as a strategy for problem solving. Other alternative explanations have linked the temporal lobe to the integration of unusual or unexpected words. As the MT gyrus remains activated for insightful problem-solving, this suggests that it could be an indicator that cognitive functions associated with this brain area are also involved in more insightful problem solving. Exposure to irrelevant speech during insight problems can increase performance; Tik and colleagues associated this finding to phonemic search during the RAT, which would have facilitated insight in their study.
Finally, the hippocampus. Previous studies have not let participants come to their own solutions, particularly to riddles, but have shown them possible answers. The hippocampus plays a key role in memory consolidation and retrieval. Research from fMRI studies has demonstrated that activation in the right hippocampus is linked to insightful problem-solving tasks and the formation of novel associations. The findings from Tik et al. (2017) support the importance of hippocampal function in the integration and reorganisation of novel associations associated with insight moments.
The results from this study suggest that the aha! moment is related to learning processes and increased involvement in creating solutions. The interplay between cortical and subcortical structures infers that the aha! moment is a higher cognitive process, not solely consisting of affective and rewarding components. As the subcortical structures found relate to the dopaminergic pathway, it is suggested by the researchers that this association with reinforcement indicates that the aha! moment is a special form of the fast retrieval, combination and encoding process.
References
Bowden, E.M. & Jung-Beeman, M. (2003). Aha! Insight experience correlates with solution activation in the right hemisphere. Psychonomic Bulletin &. Review, 10, 730–737.
Friedman, R.S. & Förster, J. (2005). Effects of motivational cues on perceptual asymmetry: Implications for creativity and analytical problem solving. Journal of Personality and Social Psychology, 88, 263–275.
Jung-Beeman, M., Bowden, E.M., Haberman, J., Frymiare, J.L., Arambel-Liu, S., Greenblatt, R., Reber, P.J. and Kounios, J. (2004). Neural activity when people solve verbal problems with insight. PLoS Biology, 2 (4), 500–510
Kizilirmak, J.M., Thuerich, H., Folta-Schoofs. K., Schott, B.H., & Richardson-Klavehn, A. (2016). Neural correlates of learning from induced insight: A case for reward-based episodic encoding. Frontiers in Psychology, 7 (Article No. 1693).
Knoblich, G., Ohlsson, S. & Raney, G.E. (2001). An eye movement study of insight problem solving. Memory & Cognition, 29, 1000–1009.
Kounios, J. & Beeman, M. (2009). The Aha! moment: The cognitive neuroscience of insight. Current Directions in Psychological Science, 18 (4), 210–216.
MacGregor, J.N., Ormerod, T.C. & Chronicle, E.P. (2001). Information processing and insight: A process model of performance on the nine-dot and related problems. Journal of Experimental Psychology: Learning, Memory, and Cognition, 27 (1), 176.
Qiu, J. & Zhang, Q. (2008). “Aha!” effects in a guessing Chinese logogriph task: An event-related potential study. Chinese Science Bulletin, 53, 384–391.
Schwartenbeck, P., FitzGerald, T.H., Mathys, C., Dolan, R. & Friston, K. (2014). The dopaminergic midbrain encodes the expected certainty about desired outcomes. Cerebral Cortex, 10, 3434–3454.
Subramaniam, K., Kounios, J., Parrish, T. B. & Jung-Beeman, M. (2009). A brain mechanism for facilitation of insight by positive affect. Journal of Cognitive Neuroscience, 21 (3), 415–432.
Tik, M., Sladky, R., Di Bernardi Luft, C. & Willinger, D. (2017). Ultra-high-field fMRI insights on insight: Neural correlates of the Aha!-moment. Human Brain Mapping, 39, 3241–3252.
Research activity
RESEARCH ACTIVITY: Cognitive reflection test
DownloadCan you answer these questions correctly?
- A bat and a ball cost $1.10 in total. The bat costs $1.00 more than the ball. How much does the ball cost? _____ cents
- If it takes 5 machines 5 minutes to make 5 widgets, how long would it take 100 machines to make 100 widgets? _____ minutes
- In a lake, there is a patch of lily pads. Every day, the patch doubles in size. If it takes 48 days for the patch to cover the entire lake, how long would it take for the patch to cover half of the lake? _____ days
In a survey of 3,428 people, an astonishing 33% missed all three questions. Most people – 83% – missed at least one of the questions.
Even very educated people made mistakes. Only 48% of MIT students sampled were able to answer all the questions correctly.
Answers
- 5 cents (not 10)
- 5 minutes (not 100)
- 47 days (not 24)
Reference
Frederick, S. (2005). Cognitive reflection and decision making. American Economic Association, 19 (4), 25–42.
Flashcards
Quiz
Chapter 13
Case study
CASE STUDY: The base-rate fallacy reconsidered
DownloadKoehler (1996) reviewed findings on use of base-rate information.
Psychological research on decision-making often shows that people tend to ignore base rates when estimating the likelihood of an event. This can happen when the probability of something is conditional on two events.
For example, suppose you were told that a taxicab was involved in a hit-and-run accident one night. Of the taxicabs in the city, 85% belonged to the Green company and 15% to the Blue company. You are then asked to estimate the likelihood that the hit-and-run accident involved a green taxicab (all else being equal). You would say that there is an 85% chance, since 85% of the cabs are green. However, suppose you were then told that an eyewitness had identified the cab as a blue cab. But when her ability to identify cabs under appropriate visibility conditions was tested, she was wrong 20% of the time. You now must decide the probability that the taxicab involved in the accident was blue.
This problem was considered by Tversky and Kahneman (1982). The way to work out the answer involves the use of Bayes’ theorem, a simple formula for calculating conditional probabilities.
In this example, the hypothesis that the cab was blue is HA and the hypothesis that it was green is HB. The prior probability for HA is 0.15, and for HB it is 0.85, because 15% of the cabs are blue and 85% are green. The probability of the eyewitness identifying the cab as blue when it was blue, p(D/HA), is 0.80. Finally, the probability of the eyewitness saying the cab was blue when it was green, p(D/HB), is 0.20. According to Bayes’ formula:
 Therefore,
This produces the values 0.12/0.17. Since the formula produces a ratio of probabilities, the ratio is 12:17. This means that the probability of the cab being blue is 12/(12+17), which is 12/29 – which works out to 0.41 or a 41% probability.
Most participants focused on what the eyewitness claimed and estimated the probability as 80%. Thus, they ignored the ratio of blue cabs to green cabs in their estimation (the base rate). Note that they overestimated that the cab was blue by almost twice the actual probability.
However, in the target article, Koehler (1996) argues that it is a myth to believe that people neglect base rates in the real world. There appears to be little evidence that base rates are routinely ignored, and, in fact, base rates are usually incorporated into the decisions that people make. Koehler argues that base-rate neglect emerged from the heuristics and biases paradigm that dominated decision research in the 1980s. It was generally accepted that people make errors or probability estimates because they rely on simple, but error-prone, rules of thumb.
It is not argued that Bayesian probability is logically flawed, but that most real-world problems do not easily map on to it. In other words, experiments on base rates have tended to have low ecological validity. Furthermore, many studies in which it is claimed that base rates are ignored may be exaggerating the case, since base rates were not completely ignored in those studies, but less weight was attached to them. In some experimental studies that use artificial problems, it has been shown that the participants readily made use of base-rate information. There are examples, too, in the real world where base-rate information is not ignored. Physicians use base-rate information of an ailment in diagnosis (Christensen-Szalanski & Bushyhead, 1981).
In the real world, base rates are learned through experience and hence may have been acquired implicitly. This makes the information more robust and more meaningful than artificially presented base-rate information provided in a single-trial experiment and made explicitly known.
According to Koehler, people may attribute less importance to base-rate information that is provided by the experiment if it is counterintuitive, appears unreal or is unlike the experiences that people have in the real world. When participants learn base-rate information over many trials, it becomes increasingly used in their judgements (e.g., Manis et al., 1980). Medin and Edelson (1988) found that base rates acquired over many trials were used in decisions, although participants had difficulty in making explicit reference to them. In addition, people may be more trusting of their own self-acquired base rates than those provided in the lab.
The evidence does not favour the view that people have a poor understanding of base rates and statistics in decision-making. For example, most people know that a low-quality football team can beat a high-quality football team on a given day, but they also know that the team is unlikely to repeat this over a larger number of games. Hence, they show knowledge of the law of large numbers.
Returning to the taxicab problem, participants might ordinarily expect not to have information about the percentage of cabs in accidents or cabs in accidents at night. They may therefore have difficulty in representing the problem without this information. When Ofir (1988) made the base rate more extreme (10% versus 90% ratio of green to blue cabs), there was strong evidence that base rates were used. It may be that when more extreme base rates are used their relevance is elevated, and in such experiments highly relevant information may dominate less-relevant information in the eyes of the participant. There is a further difficulty with the taxicab problem, in that most people know that if an eyewitness is aware of the ratio of green and blue cabs then that information is likely to influence their judgement in an ambiguous setting.
In sum, Koehler argues that the stimuli used in such experiments, the incentives of the participants, and the way in which the responses are assessed and compared with statistical norms are far removed from the real world, and hence it is difficult to draw sensible and useful conclusions from them.
References
Christensen-Szalanski, J.J.J. & Bushyhead, J.B. (1981). Physicians’ use of probabilistic information in a real clinical setting. Journal of Experimental Psychology: Human Perception and Performance, 7, 928–935.
Koehler, J.J. (1996). The base rate fallacy reconsidered: Descriptive, normative, and methodological challenges. Behavioural and Brain Sciences, 19 (1), 1–53.
Manis, M., Dovalina, I., Avis, N.E. & Cardoze, S. (1980). Base rates can affect individual predictions. Journal of Personality and Social Psychology, 38, 231–248.
Medin, D.L. & Edelson, S.M. (1988). Problem structure and the use of base-rate information from experience. Journal of Experimental Psychology: General, 117, 68–85.
Ofir, C. (1988). Pseudodiagnosticity in judgment under uncertainty. Organizational Behavior and Human Decision Processes, 42, 343–363.
Tversky, A. & Kahneman, D. (1982). Evidential impact of base rates. In D. Kahneman, P. Slovic and A. Tversky (eds), Judgment under Uncertainty: Heuristics and biases (pp. 153–160). Cambridge: Cambridge University Press.
Research activities
RESEARCH ACTIVITY 1: Smart heuristics
DownloadTest your knowledge
Print off this document and answer all the questions in both sections by circling one option for each one. Then see Research Activity 2: Smart heuristics – answers, for the correct answers to Section A questions and the rationale for the exercise.
Section A
- Which state had more rainfall in 2005?
- Mississippi
- Delaware
- Which is the longer London street?
- Clerkenwell Road
- Oxford Street
- Which is the warmer ocean current?
- The monsoon drift
- The equatorial countercurrent
- Which is the poorer country (measured by gross national product per capita in US$ in 1999)?
- Sierra Leone
- Chad
- Which country has the larger gas reserves?
- Turkmenistan
- Saudi Arabia
- Which is the larger country?
- Benin
- Uganda
- Which is the larger Scottish county?
- Aberdeenshire
- Dumfries & Galloway
- In contemporary psychological research, which psychologist is more often quoted?
- Sigmund Freud
- Solomon Asch
Section B
- What is your knowledge of American geography?
- Above average
- Average
- Below average
- What is your knowledge of London?
- Above average
- Average
- Below average
- What is your knowledge of the world’s climate?
- Above average
- Average
- Below average
- What is your knowledge of African economics?
- Above average
- Average
- Below average
- What is your knowledge of the world’s energy supplies?
- Above average
- Average
- Below average
- What is your knowledge of African geography?
- Above average
- Average
- Below average
- What is your knowledge of Scottish geography?
- Above average
- Average
- Below average
- What is your knowledge of contemporary psychology?
- Above average
- Average
- Below average
Research activity: Smart heuristics – answers [see ch13-RA-02].
RESEARCH ACTIVITY: Smart heuristics – answers
DownloadSection A answers
- a
- b
- a
- a
- b
- b
- a
- a
Rationale
According to Gigerenzer and colleagues (e.g., Gigerenzer et al., 2000), when making judgements under uncertainty, we tend to use “smart heuristics”. These are rules of thumb that we use when we have partial or incomplete knowledge. One such heuristic is the recognition heuristic, which is that, when faced with several options, we tend to select the one we are most familiar with or recognise. The reason why they are called “smart” is because they often yield the correct solution.
This exercise is to show just how useful the heuristic can be. For example, Question 2 asks, “Which is the longer London street, Clerkenwell Road or Oxford Street”? Unless you have lived in London, it is likely that you will have heard of Oxford Street but not Clerkenwell Road, so you may, using the recognition heuristic, choose to answer “Oxford Street”. However, if you are very familiar with the streets of London, you may have to think carefully about your answer – as both are long streets and, unless you travel both on a regular basis, it may be difficult to decide. In this case you may opt for either. What this shows is that an individual having less knowledge can sometimes come up with a better answer than someone with a lot of knowledge.
In the questions of Section A, the correct answers are those that are likely to be more familiar to most people, especially those without much knowledge of the topic of each question. Section B asks about your knowledge of each topic.
For Section A, group the questions into those for which you have above average knowledge and those for which you have below average knowledge based on your answers to the questions in Section B (Question 1 in Section A corresponds to Question 1 in Section B, and so on). Then find the percentage of correct answers for each group. Also keep a note of those questions for which you have average knowledge.
Predictions
The theory of the usefulness of smart heuristics predicts that, for the eight questions, you are more likely to get the questions right when you have less-than-average knowledge of the topic than when you have above-average knowledge of the topic. So, the percentage of correct answers for those questions for which you have above-average knowledge should be less than the percentage for those questions for which you have below-average knowledge.
Questions
- The theory is less clear in terms of making predictions when someone has “average knowledge”; that is, they know something of the topic but are not very familiar with it. What do your results for the questions for which you have average knowledge suggest?
- Do your data support the predictions?
- Can you think of other questions for which the more familiar item is likely to be the correct answer?
- Why might the more recognised item often be the right one?
- What might the theory have to say about questions for which the more familiar item was the wrong answer?
- Would the same predictions be upheld using “reversed” questions (such as this one)?
Which country has the smaller gas reserves?
- Turkmenistan
- Saudi Arabia
Reference
Gigerenzer, G., Todd, P.M. & the ABC Research Group (2000). Simple Heuristics that Make Us Smart. New York: Oxford University Press.
Flashcards
Quiz
Chapter 14
Case study
CASE STUDY: Exploring dual-system theories of deductive reasoning
DownloadDual-system, or dual-process, theories of reasoning hold that there is a distinction between two types of processes:
System 1 is an intuitive, tacit or implicit process.
System 2 is a rule-based, analytic or explicit process.
Since System 2 is by definition a slower system than System 1, it follows that, if System 2 can be inhibited, then we should be able to observe the effects of reasoning that are under the control of System 1.
In Experiment 1, Schroyens et al. (2003) attempted to manipulate such control by getting participants in one group to make quick decisions about the validity of a series of conclusions that followed pairs of premises. The problems were presented in the forms of affirmation of the consequent, modus ponens, modus tollens and denial of the antecedent (see Eysenck & Keane, 2015, p. 596).
One prediction would be that participants forced to make the quick decisions would have a bias to affirm most of the conclusions, but this did not occur. While participants tended to make more errors in the quick-decisions condition, they did so more with conclusions that were invalid than with conclusions that were valid. This shows that, when System 2 is inhibited, participants are less able to reject invalid inferences. The smaller number of endorsements of the conclusions in the invalid problems compared to the valid problems shows that a good deal of reasoning was being carried out in the quick-decisions group. The experiment confirms that System 1 is an important component in human reasoning.
In Experiment 2, the aim was to encourage participants to engage in System 2-type processing – that is, to attempt to employ explicit strategies of validation. This was achieved by informing one group of participants about how conclusions are evaluated in deductive reasoning, and that external factors that are irrelevant to the logic of the premises must be ignored. For example, in the literature it is known that participants can be influenced by the content of a premise even when it is irrelevant to the logic of the problem (so-called belief biases). A second group of participants were merely instructed to determine the truth or falsity of a conclusion given two premises.
The results showed an effect of instructions. The informed group (those informed about deductive reasoning) showed an increase in the accuracy of their ability to determine invalid inferences when compared with the uninformed group. This means that encouraging System 2 reasoning enables participants to reject invalid inferences.
The results provide support for the existence of two independent systems in deductive reasoning. Taken together, the results also give some indication of how the two systems operate. When there is a time constraint, participants are forced to use System 1 reasoning, a more implicit form than that of System 2, and hence are less well equipped to reject invalid inferences. When System 2 reasoning is encouraged, participants have more time to engage in a search for counterexamples, and hence are better at rejecting invalid conclusions. In sum, theories of deductive reasoning need to account for the existence of these two systems.
Reference
Eysenck, M.W., & Keane, M.T. (2015). Cognitive Psychology: A Student’s Handbook (7th Ed.). Hove: Psychology Press.
Schroyens, W., Schaeken, W. & Handley, S. (2003). In search of counter examples: Deductive rationality in human reasoning. The Quarterly Journal of Experimental Psychology, 56 (7), 1129–1145.
Research activities
RESEARCH ACTIVITY: Are humans rational?
DownloadPrint this research activity out and answer the following questions.
Question 1. Think about someone you know, see a lot and like or admire. Rate your feelings on a scale of 1 to 10 (1 = completely dislike, 10 = completely like) and enter this number here: ____
Next, list ten reasons (if you can) why you like them:
- ______________________________________________________________
- ______________________________________________________________
- ______________________________________________________________
- ______________________________________________________________
- ______________________________________________________________
- ______________________________________________________________
- ______________________________________________________________
- ______________________________________________________________
- ______________________________________________________________
- ______________________________________________________________
Question 2. Think of a type of food that you DO NOT like. Rate your feelings on a scale of 1 to 10 (1 = completely dislike, 10 = completely like) and enter this number here: ____
Next, list ten reasons (if you can) why you do not like this type of food:
- ______________________________________________________________
- ______________________________________________________________
- ______________________________________________________________
- ______________________________________________________________
- ______________________________________________________________
- ______________________________________________________________
- ______________________________________________________________
- ______________________________________________________________
- ______________________________________________________________
- ______________________________________________________________
Question 3. Think of something that you strongly believe in (such as, “We should pay more taxes to fund a better health service”, or “The war in Iraq was a big mistake”) and write it down as a statement below:
______________________________________________________________
______________________________________________________________
______________________________________________________________
______________________________________________________________
______________________________________________________________
Rate your feelings on a scale of 1 to 10 (1 = completely disagree with this statement, 10 = completely agree with this statement) and enter this number here: ____
Next, list ten reasons why you support this view:
- ______________________________________________________________
- ______________________________________________________________
- ______________________________________________________________
- ______________________________________________________________
- ______________________________________________________________
- ______________________________________________________________
- ______________________________________________________________
- ______________________________________________________________
- ______________________________________________________________
- ______________________________________________________________
Question 4. Think of a type of food that you like. Rate your feelings on a scale of 1 to 10 (1 = completely dislike, 10 = completely like) and enter this number here: ____
Next, list ten reasons why you like that type of food:
- ______________________________________________________________
- ______________________________________________________________
- ______________________________________________________________
- ______________________________________________________________
- ______________________________________________________________
- ______________________________________________________________
- ______________________________________________________________
- ______________________________________________________________
- ______________________________________________________________
- ______________________________________________________________
Question 5. Think about someone you know whom you dislike a lot. Rate your feelings on a scale of 1 to 10 (1 = completely dislike, 10 = completely like) and enter this number here: ____
Next, list ten reasons (if you can) why you don’t like them:
- ______________________________________________________________
- ______________________________________________________________
- ______________________________________________________________
- ______________________________________________________________
- ______________________________________________________________
- ______________________________________________________________
- ______________________________________________________________
- ______________________________________________________________
- ______________________________________________________________
- ______________________________________________________________
Results
You may have found it difficult to provide ten reasons for some (or all) of these questions. Enter the number of distinct reasons you gave for each question in the table below.
Question |
Issue |
Number of reasons you gave |
1. |
Someone you like |
|
2. |
Food you dislike |
|
3. |
Strong belief |
|
4. |
Food you like |
|
5. |
Someone you dislike |
Next, enter the rating value for each question in the box below, under Original rating. Then re-rate the items in each question using the same 1–10 scale, and enter these values in the New rating column.
|
Original rating |
New rating |
Question 1: Someone you like |
||
Question 2: Food you dislike |
||
Question 3: Strong belief |
||
Question 4: Food you like |
||
Question 5: Someone you dislike |
Predictions and analysis
Prediction 1: According to Wilson et al. (1989), people are not as rational as they suppose. For example, people can find it easier to verbally support weakly held beliefs, such as saying why they like a particular brand of chocolate, than strongly held beliefs, such as government policy. If so, then Wilson et al. (1989) would predict that you should have identified more reasons in either Question 2 or Question 4 (or both) than Question 3.
Prediction 2: Wilson et al. (1989) also found that this process of asking participants to justify or verbalise their beliefs often brought about a change in those beliefs, such as liking someone less as a result of listing reasons why one dislikes them. Examine your original and new ratings. Has any rating changed? If so, is this the result of finding it difficult to justify your original statements or feelings?
Analysis. Ask yourself:
- If either of the above predictions is confirmed by your own data, what does this say about human rationality?
- How is it possible that people can have strong views yet find it easier to justify a less important value such as a chocolate preference?
- What do your data or those of Wilson and his colleagues suggest about human rationality?
Reference
Wilson, T.D., Dunn, D.S., Kraft, D. & Lisle, D.J. (1989). Introspection, attitude change, and attitude-behavior consistency: The disruptive effects of explaining why we feel the way we do. In L. Berkowitz (ed.), Advances in Experimental Social Psychology (vol. 19, pp. 123–205). Orlando: Academic Press.
RESEARCH ACTIVITY: Deductive reasoning
DownloadFor each of the following, try to think up two of your own examples. For one set of examples, try to use premises or a conclusion that contradicts what most people are likely to believe. Test your examples on your friends to see if they make more errors on this type of task. Reasoning theorists such as Byrne (1989) would predict that they will do so, because in many reasoning experiments participants are greatly influenced by such contextual information, which is not strictly relevant to logical deduction.
1. Affirmation of the consequent
Example from the textbook (see p. 673):
Premises
If Nancy is angry, then I am upset.
I am upset.
Conclusion
Therefore, Nancy is angry.
2. Modus ponens
Example from the textbook (see p. 673):
Premises
If it is raining, then Nancy gets wet.
It is raining.
Conclusion
Nancy gets wet.
3. Modus tollens
Example from the textbook (see p. 673):
Premises
If it is raining, then Nancy gets wet.
Nancy does not get wet.
Conclusion
It is not raining.
4. Denial of the antecedent
Example from the textbook (see p. 674):
Premises
If it is raining, then Nancy gets wet.
It is not raining.
Conclusion
Therefore, Nancy does not get wet.
Reference
Byrne, R.M.J. (1989). Suppressing valid inferences with conditionals. Cognition, 31,
61–63.
Flashcards
Quiz
Chapter 15
Case studies
CASE STUDY: Basic emotions as natural kinds
DownloadMany psychologists would agree that there are discrete emotions such as joy, sadness, anger and fear, but there is no consensus on a definition of the term emotion. Furthermore, there is disagreement on the processes that activate emotions, and the role of emotions in daily activities and pursuits. Additionally, there are inconsistencies with the view that there are kinds of emotion with boundaries that are carved in nature (Barrett, 2006).
Izard (2007) argues that basic emotions such as interest, joy/happiness, sadness, anger, disgust and fear may be considered as “natural kinds”. That is, they are a category of phenomena that are given by nature, have similar observable properties and are alike in some significant way. These properties include the capacity to regulate and motivate cognition and action. According to Izard, a basic emotion has five components or characteristics that support its classification as a natural kind:
- Basic emotions involve internal bodily activity, and expression of these emotions emerges early in ontogeny (for example, infants show more interest in a human face than in a mannequin).
- Activation of a basic emotion depends on perception of an ecologically valid stimulus (like a mother’s face).
- A basic emotion has a unique feeling component that can be conceptualised as a phase of the associated neurobiological process.
- A basic emotion has unique regulatory properties that modulate cognition and action.
- A basic emotion has non-cyclic motivational capacities.
There is substantial evidence that basic emotions have evolutionarily based neurobiological roots, and at least partially dedicated neural systems, for example in the brainstem and limbic structures. Even early in development, basic emotions can be functional and motivational in unique ways, for example in recruiting and organising motor response systems.
Important work by Okon-Singer and colleagues (2006) inferred an association between emotion and cognition. As a result of this study, prior conceptions and beliefs about the “emotional brain” and the “cognitive brain” become seemingly flawed. They suggested that by developing a deeper understanding of the emotional-cognitive brain, not just the mind can be understood, but also root causes of its disorders might also be explained.
In sum, Izard argues that each basic emotion has distinct universal and unlearned regulatory and motivational characteristics. For example, the basic emotion of interest may serve to focus and sustain attention and motivate exploration and learning. In contrast, the emotion of fear inhibits approach and motivates escape or protective behaviour. These characteristics can be considered as a cluster of properties that define basic emotions as natural kinds.
Reference
Barrett, L.F. (2006). Are emotions natural kinds? Perspectives on Psychological Science, 1 (1), 28–58.
Izard, C.E. (2007). Basic emotions, natural kinds, emotion schemas, and a new paradigm. Perspectives on Psychological Science, 2 (3),260–280.
Okon-Singer, H., Hendler, T., Pessoa, L. & Shackman, A.J. (2006). The neurobiology of emotion-cognition interactions: Fundamental questions and strategies for future research. Frontiers in Human Neuroscience, 9 (58), 1–14.
CASE STUDY: Hills, Werno and Lewis (2011)
DownloadThere has been a great deal of research conducted on how mood affects cognitive and perceptual processes. Much of this work indicates the detrimental effects of sad mood on cognitive processing. However, many of the studies showing such deleterious effects of negative mood on cognition used cognitively demanding tasks. When using simpler tasks, the differences in cognitive performance due to mood are less obvious. More subtle processing differences have been reported, such as the fact that happy people tend to focus on the “gist”, rather than on details of a scene.
Face perception is an expert human cognitive ability. It encompasses a wide variety of cognitive and perceptual systems and recruits a vast network of brain regions. This suggests face perception is a complex task and therefore should be negatively affected by mood. However, existing data are inconclusive regarding this point. Ridout et al. (2003) have shown that patients with major depression recognised more sad faces than happy faces but no differences in overall recognition performance. This suggests depression is associated with a mood-congruency bias (Bower, 1981). Furthermore, Jermann et al. (2008) found depression was not associated with the recognition of facial identity, but it did affect the recollection of facial expressions. However, Jermann et al.’s study confounded learning type (incidental and intentional) with recognition type (identity and expression respectively). Finally, sad-induced participants show less expert face processing than happy-induced participants (Curby et al., 2009).
These inconsistent results were tested by Hills et al. (2011) in three experiments. They aimed to address whether mood affected face-recognition accuracy or not (and whether this was moderated by type of learning) and whether there was evidence of a mood-congruency bias in sad-induced participants. To do this, they conducted an old/new recognition paradigm on participants who were induced in happy, sad or neutral moods.
Three experiments were conducted using the same basic procedure:
Experiment 1
- Conditions:
- Happy induction
- Sad induction
- Neutral induction
- No induction
- Types of face:
- Neutral expression
- Type of learning:
- Incidental
Experiment 2
- Conditions:
- Happy induction
- Sad induction
- Neutral induction
- Types of face:
- Happy expression
- Sad expression
- Neutral expression
- Type of learning:
- Incidental
- Remember/know procedure
Experiment 3
- Conditions:
- Happy induction
- Sad induction
- Neutral induction
- Types of face:
- Happy expression
- Sad expression
- Neutral expression
- Type of learning:
- Intentional
- Remember/know procedure
The procedure was as follows:
Hills et al. (2011) demonstrated in Experiments 1 and 2 that sad people were more accurate than happy people at face recognition and produced more remember responses than happy participants. Happy people were less accurate, were faster and relied more on feelings of familiarity during face recognition than sad participants in Experiments 1 and 2. There were no differences in Experiment 3.
These results suggest that happy people use more heuristics in face recognition, relying on feelings of familiarity to make recognition judgements, whereas sad people made more effort to be accurate. Surprisingly, sad people showed better face recognition, despite the fact that they have been shown to use less expert face-recognition processes. This suggests that either measures of holistic processing do not correlate with face-recognition accuracy (which has been found) or that sad participants engage in other forms of processing to ensure accuracy in face recognition. Mood congruency was observed for happy participants more strongly than sad participants (consistent with previous research). Furthermore, these results only occur when participants were not intentionally trying to learn the faces.
These results are consistent with sad mood being associated with defocused attention. It may mean that sad people encode areas of the face they would not normally do. Indeed, Hills and Lewis (2011) have shown that sad people can detect changes to areas of faces that happy people cannot.
There are some limitations to the work of Hills et al. (2011). First, in all of their studies, the happy mood induction was less effective than the sad mood induction. This could potentially be misleading as the intensity of the emotional state may cause differential effects in face recognition. Second, the mood induction music employed has effects on engagement, arousal and interest as well as on happiness and sadness: the happy mood induction made people more entertained and interested than the other conditions. Third, the precise mechanisms of the sad participants’ improved (or happy participants’ reduced) face-recognition ability have not been explained. Finally, Hills et al. were not able to identify whether this was an effect due to encoding or recognition.
References
Bower, G.H. (1981). Mood and memory. American Psychologist, 36, 129–148.
Curby, K., Johnson, K. & Tyson, A. (2009). Perceptual expertise has an emotional side: Holistic face processing is modulated by observers’ emotional state. Journal of Vision, 9 (8), 510.
Hills, P.J. & Lewis, M.B. (2011). Sad people avoid the eyes or happy people focus on the eyes? Mood induction affects facial feature discrimination. British Journal of Psychology, 102, 260–274.
Hills, P.J., Werno, M.A. & Lewis, M.B. (2011). Sad people are more accurate at face recognition than happy people. Consciousness and Cognition, 20, 1502–1517.
Jermann, F., van der Linden, M. & D’Argembeau, A. (2008). Identity recognition and happy and sad facial expression recall: Influence of depressive symptoms. Memory, 16, 364–373.
Ridout, N., Astell, A.J., Reid, I., Glen, T. & O’Carroll, R. (2003). Memory bias for emotional facial expressions in major depression. Cognition and Emotion, 17, 101–122.
Research activity
RESEARCH ACTIVITY: Appraisal–emotion relationships in daily life
DownloadAppraisal theories have widespread acceptance in the field of emotion research. In these theories, it is assumed that a situation elicits in the individual a set of appraisals, and that the distinct patterns of these appraisals are associated with the experience of specific emotions. Most of the research on cognitive appraisals has been conducted using hypothetical vignettes or autobiographical recall. These have shortcomings as vignettes lack immediacy and personal importance, and autobiographical memories are prone to bias. The purpose of this activity is to examine the extent to which people’s daily emotional experiences follow patterns predicted by the cognitive appraisal theory of emotions.
The task
You will need a wristwatch with an alarm, a pencil and a recording booklet. You will need to record nine observations in the course of a day at the exact moment when your wristwatch alarm goes off. For the first observation, set your wristwatch alarm to a time in the morning shortly after you normally wake up (e.g., 8:30 am). For subsequent observations, set the alarm at intervals approximately 90 minutes from the last observation. At each observation, complete the following questionnaire by rating each sentence on an 11-point scale from 0 (not applicable at all) to 10 (completely applicable). In total, you will complete the questionnaire nine times.
Questionnaire
Sentence to rate Rating (0 to 10)
1. At this moment, I feel content. ______2. At this moment, I feel nervous. ______
3. At this moment, I experience a positive encounter. ______
4. At this moment, I feel guilty. ______
5. At this moment, I feel sorrowful. ______
6. At this moment, I experience a success. ______
7. At this moment, I feel sad. ______
8. At this moment, I feel fear. ______
9. At this moment, I blame someone else. ______
10. At this moment, I feel angry. ______
11. At this moment, I feel affection. ______
12. At this moment, I feel threatened. ______
13. At this moment, I feel irritation. ______
14. At this moment, I feel ashamed. ______
15. At this moment, I feel sympathy. ______
16. At this moment, I experience a loss. ______
17. At this moment, I feel happy. ______
18. At this moment, I blame myself. ______
Current time: ______
Dealing with the data
Calculate your mean rating scores across the nine observations for each of the following sentences. Where there are two sentences, take the average of the 18 observations.
Emotions |
Sentence number(s) |
Your mean rating |
Mean ratings in Nezlek et al.’s (2008) study |
Anger |
10, 13 |
1.10 |
|
Guilt |
4, 14 |
0.43 |
|
Fear |
2, 8 |
0.97 |
|
Sadness |
5, 7 |
0.88 |
|
Joy |
1, 17 |
5.11 |
|
Love |
11, 15 |
3.58 |
|
Appraisals |
Sentence number |
Your mean rating |
|
Other blame |
9 |
1.34 |
|
Self-blame |
18 |
0.86 |
|
Threat |
12 |
0.46 |
|
Loss |
16 |
0.55 |
|
Success |
6 |
1.45 |
|
Positive encounter |
3 |
3.16 |
Predictions
According to the cognitive appraisal theory (Smith & Lazarus, 1993), daily emotional experiences are associated with core relational themes and follow the following patterns:
- Other blame – Anger
- Self-blame – Guilt
- Danger/threat – Fear
- Loss/helplessness – Sadness
- Achievement/success – Joy
- Positive encounters – Love
Hence, if you scored higher on a particular emotion at each time point, you should also have scored higher on the relevant appraisal pattern.
Ask yourself:
- What were the most dominant emotions you experienced throughout the day? Were they more positive or more negative?
- At each time point, was your cognitive appraisal consistent with your experienced emotions, as predicted by the cognitive appraisal theory?
- How did your scores compare to those in the Nezlek et al. (2008) study?
- Ask a friend to complete the same activity. How did his/her scores compare with yours?
References
Nezlek, J.B., Vansteelandt, K., Van Machelen, I. & Kuppens, P. (2008). Appraisal–emotion relationships in daily life. Emotion, 8 (1), 145–150.
Smith, C.A. & Lazarus, R.S. (1993). Appraisal components, core relational themes, and the emotions. Cognition and Emotion, 7, 233–269.
Flashcards
Quiz
Chapter 16
Case study
CASE STUDY: Towards a true neural stance on consciousness (Lamme, 2006)
DownloadConsciousness is a complex phenomenon. Why do some processes in the brain evoke conscious experiences, but others do not? A difficulty with traditional behavioural measures of consciousness is that a demonstration of the presence or absence of consciousness is dependent on other cognitive functions such as language (e.g., for reporting), memory and attention. This makes it difficult to dissociate consciousness from these other cognitive functions. Lamme (2006, 2010) argues that, in order to truly address the mind–brain relationship in consciousness, neural and behavioural measures need to be put on equal footing. He uses the example of visual consciousness to illustrate this point.
When a new image hits the retina, it is processed through successive levels of the visual cortex by means of feedforward connections. In only around 100–150 ms, the brain “knows” about the new image. This feedforward sweep enables rapid extraction of complex and meaningful features from the visual scene and potential motor responses are prepared. Studies in humans and monkeys seem to indicate that, no matter what area of the brain is reached by the feedforward sweep, this in itself does not produce reportable conscious experience. What seems necessary for conscious experience is that neurons in visual areas engage in recurrent processing where high- and low-level areas interact.
Lamme argues that it is this widespread, recurrent processing that forms the key neural ingredient of consciousness. Crucially, he argues that recurrent processing is fundamentally different from feedforward processing in that it creates a condition that satisfies the Hebb rule: pre- and postsynaptic neurons are active simultaneously. This triggers the activation of synaptic plasticity processes that are the neural basis of learning and memory. If one of the functions of consciousness is to allow for learning, then recurrent processing fits the criteria necessary for neural learning to occur.
By defining visual consciousness in such “neural terms”, several testable predictions ensue. First, recurrent processing should be necessary for conscious experience. Second, learning should follow the phenomenal aspects of stimuli (e.g., colour) rather than their physical features (e.g., wavelength), even when what is learned is not reportable. An advantage to adopting such a “neural stance” to consciousness is that consciousness may now be dissociated from other cognitive functions, such as attention, working memory and reportability. We would also be able to measure the presence or absence of consciousness without resorting to behavioural measures, opening avenues to investigate consciousness in coma, anaesthesia or animals. Rather than inferring consciousness from behavioural measures, our understanding of consciousness should emerge from arguments of neuroscience.
Reference
Lamme, V.A.F. (2006). Towards a true neural stance on consciousness. Trends in Cognitive Sciences, 10 (11),494–500.
Lamme, V.A.F. (2010). How neuroscience will change our view on consciousness. Cognitive Neuroscience: Current Debates, Research & Reports, 1 (3), 204–220.
Research activity
RESEARCH ACTIVITY: From intention to action
DownloadHow long does it take for the brain to translate our conscious intentions into actions? In this research activity, we will explore the relationship between deciding to perform a motor action (raising a finger), and actually executing the action.
The task
For this task, you will also need an accurate stopwatch (able to measure tens of milliseconds), and a large analogue clock face with an accurate second hand.
Hold the stopwatch in one hand and watch the analogue clock face carefully. Start the stopwatch at the precise moment when the second hand of the clock crosses the “12” mark. You may need to practise this a few times to make sure that the timings on the watch and clock are synchronised. Now begin the experiment.
As before, start the stopwatch when the second hand of the clock crosses “12”. Then, at some point within the next minute, randomly make a decision to stop the stopwatch, while at the same time carefully noting what the position of the second hand of the clock was when you made the decision. This should give you two readings:
- The position of the second hand on the analogue clock face (when you made the decision).
- The digital reading of the stopwatch (when you actually performed the action).
Record these two values on a sheet of paper. Repeat this at least 25 times and record your readings each time.
Dealing with the data
You should have a table with two columns, one indicating the timing of your decision, and one indicating the timing of your action, as shown below. To obtain the time taken to execute the action on each trial, subtract the timing of your decision (clock) from the timing of your action (stopwatch). Take the average of all the values in the final column. This is an approximation of the average time taken for you to translate conscious intention into motor action.
Trial no. |
Timing of decision (clock) |
Timing of action (stopwatch) |
Time taken to execute action |
1. |
e.g., 43.5 s |
e.g., 43.83 s |
e.g., 0.33 s |
2. |
|||
3. |
|||
4. |
|||
5. |
|||
6. |
|||
7. |
|||
8. |
|||
9. |
|||
10. |
|||
11. |
|||
12. |
|||
13. |
|||
14. |
|||
15. |
|||
16. |
|||
17. |
|||
18. |
|||
19. |
|||
20. |
|||
21. |
|||
22. |
|||
23. |
|||
24. |
|||
25. |
|||
Average |
|||
Predictions
You should find that your conscious decision precedes the actual action of stopping the stopwatch by at least 200 ms.
One of the first experiments to address the timing of decisions directly was conducted by Benjamin Libet and his colleagues in 1983. In this experiment, subjects watched a rapidly moving clock hand and made a mental note of when they decided to lift their finger. At the same time, an electromyogram recorded their actual muscle activity, and EEG activity in the brain was also measured.
The EEG results demonstrated that the cortex became active with a “readiness potential” about 350 ms before participants reported awareness of a “wish to move”. Actual muscle activity followed some 200 ms after this.
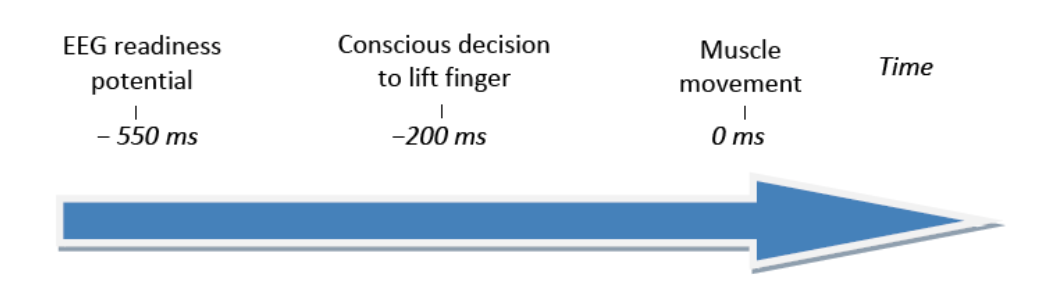
This experiment suggested that our subjective awareness of a decision occurs measurably later than the actual event of deciding occurs in the brain.
Ask yourself:
- Does conscious awareness of a decision precede or follow from brain “preparatory” activity?
- Is it possible to stop an action that is already being prepared by the brain?
Reference
Libet B., Gleason, C.A., Wright, E.W. & Pearl, D.K. (1983). Time of conscious intention to act in relation to onset of cerebral activity (readiness-potential). The unconscious initiation of a freely voluntary act. Brain, 106, 623–642.